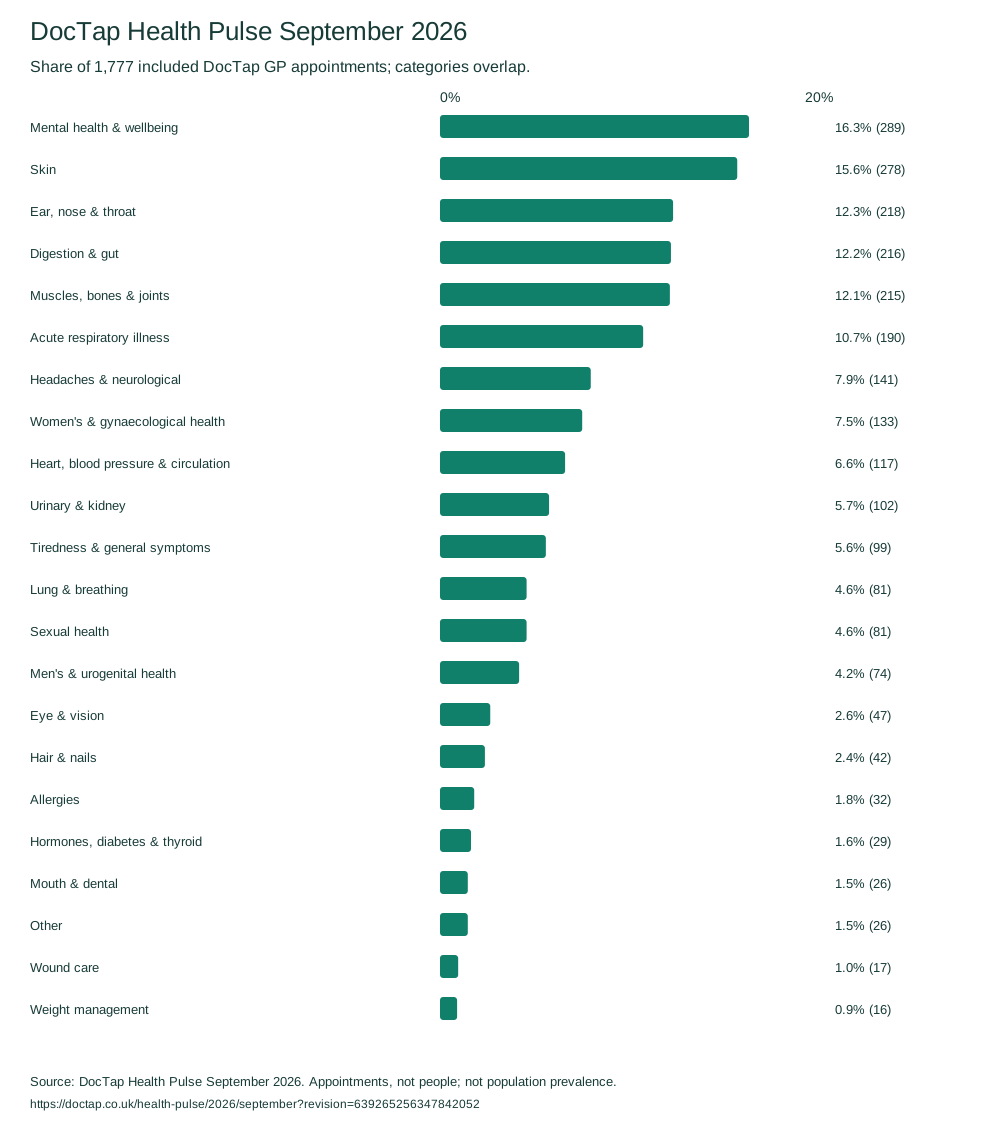
DocTap Health Pulse · September 2026
Mental health featured in around one in six DocTap appointments in September
In September 2026, mental health and wellbeing concerns featured in 16.3% of DocTap appointments, compared with 14.5% in September 2025. This category includes stress and sleep concerns.
Clinically reviewed and approved by Dr Gugulethu Ndlovu · Published 2 October 2026
Full report, methodology and complete topic appendix.
DocTap is a private GP service in the UK, with clinic and remote appointments. See our clinics. These figures describe concerns addressed in its GP appointments, not the wider population. An appointment can involve more than one category.
Findings in this edition
Mental health reviews outnumbered new concerns
In September, 135 of the 248 DocTap appointments where mental health and wellbeing was a main concern were follow-up reviews; 113 addressed a new concern.
+1.6 pp
Colds came up in a higher share than last September
Colds and upper respiratory infections featured in 6.0% of DocTap appointments in September 2026, compared with 4.4% in September 2025.
-2.0 pp
Urinary tract infections featured less often
Urinary tract infection concerns, including suspected infections, featured in 3.5% of DocTap appointments in September 2026, compared with 5.5% in September 2025.
Which concerns came up?
Select a group to see its topics. Use “View trends” to explore any group or topic over time.
Appointments, not people or confirmed diagnoses. Topics overlap; each appointment counts once in a group. All shares use the full period's qualifying appointments.
Share of all qualifying DocTap consultations in September 2026.
Monthly shares, October 2025–September 2026. Every chart uses 0–25%. Gaps mean unavailable.
September 2026 compared with September 2025. Calendar coverage: September 2026 (1 of 3 calendar months).
October 2025–September 2026. Unavailable if any of the 12 months is missing or has no qualifying appointments.
Mental health & wellbeingShow 11 topics Hide topics 16.3% 16.7% 16.3%14.5% last year
AnxietyView figures and history 11.5% 12.0% 11.5%9.9% last year
Anxiety
Anxiety concerns, including assessment, treatment and review.
205 of 1,777 qualifying appointments addressed this concern.
Trailing 12 months: 2,410 appointments (12.0%) of 20,033.
Exact monthly figures — all saved history
| Month | Topic appointments | Qualifying appointments | Share |
|---|---|---|---|
| June 2025 | 178 | 1,787 | 10.0% |
| July 2025 | 135 | 1,617 | 8.3% |
| August 2025 | 180 | 1,451 | 12.4% |
| September 2025 | 155 | 1,560 | 9.9% |
| October 2025 | 161 | 1,450 | 11.1% |
| November 2025 | 170 | 1,505 | 11.3% |
| December 2025 | 179 | 1,603 | 11.2% |
| January 2026 | 202 | 1,739 | 11.6% |
| February 2026 | 182 | 1,607 | 11.3% |
| March 2026 | 195 | 1,843 | 10.6% |
| April 2026 | 207 | 1,725 | 12.0% |
| May 2026 | 280 | 1,797 | 15.6% |
| June 2026 | 212 | 1,697 | 12.5% |
| July 2026 | 211 | 1,733 | 12.2% |
| August 2026 | 206 | 1,557 | 13.2% |
| September 2026 | 205 | 1,777 | 11.5% |
Seasonal comparisons — matched periods
| Period | Appointments / qualifying | Share | Last year | Change |
|---|---|---|---|---|
| June 2025–August 2025 | 493 / 4,855 | 10.2% | June 2024–August 2024: Unavailable / Unavailable (Unavailable) | — |
| September 2025–November 2025 | 486 / 4,515 | 10.8% | September 2024–November 2024: Unavailable / Unavailable (Unavailable) | — |
| December 2025–February 2026 | 563 / 4,949 | 11.4% | December 2024–February 2025: Unavailable / Unavailable (Unavailable) | — |
| March 2026–May 2026 | 682 / 5,365 | 12.7% | March 2025–May 2025: Unavailable / Unavailable (Unavailable) | — |
| June 2026–August 2026 | 629 / 4,987 | 12.6% | June 2025–August 2025: 493 / 4,855 (10.2%) | +2.5 pp |
| September 2026 | 205 / 1,777 | 11.5% | September 2025: 155 / 1,560 (9.9%) | +1.6 pp |
Depression & low moodView figures and history 6.2% 6.7% 6.2%5.4% last year
Depression & low mood
Depression or low mood discussed or assessed.
110 of 1,777 qualifying appointments addressed this concern.
Trailing 12 months: 1,334 appointments (6.7%) of 20,033.
Exact monthly figures — all saved history
| Month | Topic appointments | Qualifying appointments | Share |
|---|---|---|---|
| June 2025 | 97 | 1,787 | 5.4% |
| July 2025 | 86 | 1,617 | 5.3% |
| August 2025 | 99 | 1,451 | 6.8% |
| September 2025 | 85 | 1,560 | 5.4% |
| October 2025 | 85 | 1,450 | 5.9% |
| November 2025 | 94 | 1,505 | 6.2% |
| December 2025 | 108 | 1,603 | 6.7% |
| January 2026 | 94 | 1,739 | 5.4% |
| February 2026 | 91 | 1,607 | 5.7% |
| March 2026 | 116 | 1,843 | 6.3% |
| April 2026 | 133 | 1,725 | 7.7% |
| May 2026 | 149 | 1,797 | 8.3% |
| June 2026 | 114 | 1,697 | 6.7% |
| July 2026 | 120 | 1,733 | 6.9% |
| August 2026 | 120 | 1,557 | 7.7% |
| September 2026 | 110 | 1,777 | 6.2% |
Seasonal comparisons — matched periods
| Period | Appointments / qualifying | Share | Last year | Change |
|---|---|---|---|---|
| June 2025–August 2025 | 282 / 4,855 | 5.8% | June 2024–August 2024: Unavailable / Unavailable (Unavailable) | — |
| September 2025–November 2025 | 264 / 4,515 | 5.8% | September 2024–November 2024: Unavailable / Unavailable (Unavailable) | — |
| December 2025–February 2026 | 293 / 4,949 | 5.9% | December 2024–February 2025: Unavailable / Unavailable (Unavailable) | — |
| March 2026–May 2026 | 398 / 5,365 | 7.4% | March 2025–May 2025: Unavailable / Unavailable (Unavailable) | — |
| June 2026–August 2026 | 354 / 4,987 | 7.1% | June 2025–August 2025: 282 / 4,855 (5.8%) | +1.3 pp |
| September 2026 | 110 / 1,777 | 6.2% | September 2025: 85 / 1,560 (5.4%) | +0.7 pp |
Stress & burnoutView figures and history 4.4% 3.7% 4.4%2.8% last year
Stress & burnout
Stress or burnout concerns, including work-related concerns discussed at the appointment.
78 of 1,777 qualifying appointments addressed this concern.
Trailing 12 months: 744 appointments (3.7%) of 20,033.
Exact monthly figures — all saved history
| Month | Topic appointments | Qualifying appointments | Share |
|---|---|---|---|
| June 2025 | 48 | 1,787 | 2.7% |
| July 2025 | 46 | 1,617 | 2.8% |
| August 2025 | 50 | 1,451 | 3.4% |
| September 2025 | 43 | 1,560 | 2.8% |
| October 2025 | 44 | 1,450 | 3.0% |
| November 2025 | 52 | 1,505 | 3.5% |
| December 2025 | 59 | 1,603 | 3.7% |
| January 2026 | 57 | 1,739 | 3.3% |
| February 2026 | 44 | 1,607 | 2.7% |
| March 2026 | 60 | 1,843 | 3.3% |
| April 2026 | 70 | 1,725 | 4.1% |
| May 2026 | 88 | 1,797 | 4.9% |
| June 2026 | 57 | 1,697 | 3.4% |
| July 2026 | 70 | 1,733 | 4.0% |
| August 2026 | 65 | 1,557 | 4.2% |
| September 2026 | 78 | 1,777 | 4.4% |
Seasonal comparisons — matched periods
| Period | Appointments / qualifying | Share | Last year | Change |
|---|---|---|---|---|
| June 2025–August 2025 | 144 / 4,855 | 3.0% | June 2024–August 2024: Unavailable / Unavailable (Unavailable) | — |
| September 2025–November 2025 | 139 / 4,515 | 3.1% | September 2024–November 2024: Unavailable / Unavailable (Unavailable) | — |
| December 2025–February 2026 | 160 / 4,949 | 3.2% | December 2024–February 2025: Unavailable / Unavailable (Unavailable) | — |
| March 2026–May 2026 | 218 / 5,365 | 4.1% | March 2025–May 2025: Unavailable / Unavailable (Unavailable) | — |
| June 2026–August 2026 | 192 / 4,987 | 3.9% | June 2025–August 2025: 144 / 4,855 (3.0%) | +0.9 pp |
| September 2026 | 78 / 1,777 | 4.4% | September 2025: 43 / 1,560 (2.8%) | +1.6 pp |
Insomnia & sleep concernsShow 2 topics Hide topics 3.7% 4.5% 3.7%3.1% last year
InsomniaView figures and history 3.6% 4.2% 3.6%2.7% last year
Insomnia
Insomnia specifically discussed or assessed.
64 of 1,777 qualifying appointments addressed this concern.
Trailing 12 months: 834 appointments (4.2%) of 20,033.
Exact monthly figures — all saved history
| Month | Topic appointments | Qualifying appointments | Share |
|---|---|---|---|
| June 2025 | 40 | 1,787 | 2.2% |
| July 2025 | 27 | 1,617 | 1.7% |
| August 2025 | 55 | 1,451 | 3.8% |
| September 2025 | 42 | 1,560 | 2.7% |
| October 2025 | 49 | 1,450 | 3.4% |
| November 2025 | 53 | 1,505 | 3.5% |
| December 2025 | 58 | 1,603 | 3.6% |
| January 2026 | 74 | 1,739 | 4.3% |
| February 2026 | 70 | 1,607 | 4.4% |
| March 2026 | 61 | 1,843 | 3.3% |
| April 2026 | 91 | 1,725 | 5.3% |
| May 2026 | 127 | 1,797 | 7.1% |
| June 2026 | 64 | 1,697 | 3.8% |
| July 2026 | 63 | 1,733 | 3.6% |
| August 2026 | 60 | 1,557 | 3.9% |
| September 2026 | 64 | 1,777 | 3.6% |
Seasonal comparisons — matched periods
| Period | Appointments / qualifying | Share | Last year | Change |
|---|---|---|---|---|
| June 2025–August 2025 | 122 / 4,855 | 2.5% | June 2024–August 2024: Unavailable / Unavailable (Unavailable) | — |
| September 2025–November 2025 | 144 / 4,515 | 3.2% | September 2024–November 2024: Unavailable / Unavailable (Unavailable) | — |
| December 2025–February 2026 | 202 / 4,949 | 4.1% | December 2024–February 2025: Unavailable / Unavailable (Unavailable) | — |
| March 2026–May 2026 | 279 / 5,365 | 5.2% | March 2025–May 2025: Unavailable / Unavailable (Unavailable) | — |
| June 2026–August 2026 | 187 / 4,987 | 3.7% | June 2025–August 2025: 122 / 4,855 (2.5%) | +1.2 pp |
| September 2026 | 64 / 1,777 | 3.6% | September 2025: 42 / 1,560 (2.7%) | +0.9 pp |
Other sleep concernsView figures and history 0.1% 0.3% 0.1%0.4% last year
Other sleep concerns
Other non-respiratory sleep concerns.
2 of 1,777 qualifying appointments addressed this concern.
Trailing 12 months: 63 appointments (0.3%) of 20,033.
Exact monthly figures — all saved history
| Month | Topic appointments | Qualifying appointments | Share |
|---|---|---|---|
| June 2025 | 3 | 1,787 | 0.2% |
| July 2025 | 3 | 1,617 | 0.2% |
| August 2025 | 4 | 1,451 | 0.3% |
| September 2025 | 7 | 1,560 | 0.4% |
| October 2025 | 2 | 1,450 | 0.1% |
| November 2025 | 1 | 1,505 | 0.1% |
| December 2025 | 5 | 1,603 | 0.3% |
| January 2026 | 6 | 1,739 | 0.3% |
| February 2026 | 8 | 1,607 | 0.5% |
| March 2026 | 6 | 1,843 | 0.3% |
| April 2026 | 7 | 1,725 | 0.4% |
| May 2026 | 6 | 1,797 | 0.3% |
| June 2026 | 5 | 1,697 | 0.3% |
| July 2026 | 6 | 1,733 | 0.3% |
| August 2026 | 9 | 1,557 | 0.6% |
| September 2026 | 2 | 1,777 | 0.1% |
Seasonal comparisons — matched periods
| Period | Appointments / qualifying | Share | Last year | Change |
|---|---|---|---|---|
| June 2025–August 2025 | 10 / 4,855 | 0.2% | June 2024–August 2024: Unavailable / Unavailable (Unavailable) | — |
| September 2025–November 2025 | 10 / 4,515 | 0.2% | September 2024–November 2024: Unavailable / Unavailable (Unavailable) | — |
| December 2025–February 2026 | 19 / 4,949 | 0.4% | December 2024–February 2025: Unavailable / Unavailable (Unavailable) | — |
| March 2026–May 2026 | 19 / 5,365 | 0.4% | March 2025–May 2025: Unavailable / Unavailable (Unavailable) | — |
| June 2026–August 2026 | 20 / 4,987 | 0.4% | June 2025–August 2025: 10 / 4,855 (0.2%) | +0.2 pp |
| September 2026 | 2 / 1,777 | 0.1% | September 2025: 7 / 1,560 (0.4%) | -0.3 pp |
View trends
Insomnia & sleep concerns
Insomnia and other non-respiratory sleep concerns.
66 of 1,777 qualifying appointments addressed this concern.
Trailing 12 months: 896 appointments (4.5%) of 20,033.
Exact monthly figures — all saved history
| Month | Topic appointments | Qualifying appointments | Share |
|---|---|---|---|
| June 2025 | 43 | 1,787 | 2.4% |
| July 2025 | 30 | 1,617 | 1.9% |
| August 2025 | 59 | 1,451 | 4.1% |
| September 2025 | 49 | 1,560 | 3.1% |
| October 2025 | 51 | 1,450 | 3.5% |
| November 2025 | 54 | 1,505 | 3.6% |
| December 2025 | 63 | 1,603 | 3.9% |
| January 2026 | 80 | 1,739 | 4.6% |
| February 2026 | 78 | 1,607 | 4.9% |
| March 2026 | 67 | 1,843 | 3.6% |
| April 2026 | 98 | 1,725 | 5.7% |
| May 2026 | 133 | 1,797 | 7.4% |
| June 2026 | 69 | 1,697 | 4.1% |
| July 2026 | 69 | 1,733 | 4.0% |
| August 2026 | 68 | 1,557 | 4.4% |
| September 2026 | 66 | 1,777 | 3.7% |
Seasonal comparisons — matched periods
| Period | Appointments / qualifying | Share | Last year | Change |
|---|---|---|---|---|
| June 2025–August 2025 | 132 / 4,855 | 2.7% | June 2024–August 2024: Unavailable / Unavailable (Unavailable) | — |
| September 2025–November 2025 | 154 / 4,515 | 3.4% | September 2024–November 2024: Unavailable / Unavailable (Unavailable) | — |
| December 2025–February 2026 | 221 / 4,949 | 4.5% | December 2024–February 2025: Unavailable / Unavailable (Unavailable) | — |
| March 2026–May 2026 | 298 / 5,365 | 5.6% | March 2025–May 2025: Unavailable / Unavailable (Unavailable) | — |
| June 2026–August 2026 | 206 / 4,987 | 4.1% | June 2025–August 2025: 132 / 4,855 (2.7%) | +1.4 pp |
| September 2026 | 66 / 1,777 | 3.7% | September 2025: 49 / 1,560 (3.1%) | +0.6 pp |
Other mental health concernsView figures and history 0.7% 0.7% 0.7%0.3% last year
Other mental health concerns
Other mental health concerns without a more specific recorded category.
13 of 1,777 qualifying appointments addressed this concern.
Trailing 12 months: 131 appointments (0.7%) of 20,033.
Exact monthly figures — all saved history
| Month | Topic appointments | Qualifying appointments | Share |
|---|---|---|---|
| June 2025 | 15 | 1,787 | 0.8% |
| July 2025 | 8 | 1,617 | 0.5% |
| August 2025 | 7 | 1,451 | 0.5% |
| September 2025 | 5 | 1,560 | 0.3% |
| October 2025 | 6 | 1,450 | 0.4% |
| November 2025 | 7 | 1,505 | 0.5% |
| December 2025 | 5 | 1,603 | 0.3% |
| January 2026 | 14 | 1,739 | 0.8% |
| February 2026 | 9 | 1,607 | 0.6% |
| March 2026 | 13 | 1,843 | 0.7% |
| April 2026 | 10 | 1,725 | 0.6% |
| May 2026 | 14 | 1,797 | 0.8% |
| June 2026 | 10 | 1,697 | 0.6% |
| July 2026 | 15 | 1,733 | 0.9% |
| August 2026 | 15 | 1,557 | 1.0% |
| September 2026 | 13 | 1,777 | 0.7% |
Seasonal comparisons — matched periods
| Period | Appointments / qualifying | Share | Last year | Change |
|---|---|---|---|---|
| June 2025–August 2025 | 30 / 4,855 | 0.6% | June 2024–August 2024: Unavailable / Unavailable (Unavailable) | — |
| September 2025–November 2025 | 18 / 4,515 | 0.4% | September 2024–November 2024: Unavailable / Unavailable (Unavailable) | — |
| December 2025–February 2026 | 28 / 4,949 | 0.6% | December 2024–February 2025: Unavailable / Unavailable (Unavailable) | — |
| March 2026–May 2026 | 37 / 5,365 | 0.7% | March 2025–May 2025: Unavailable / Unavailable (Unavailable) | — |
| June 2026–August 2026 | 40 / 4,987 | 0.8% | June 2025–August 2025: 30 / 4,855 (0.6%) | +0.2 pp |
| September 2026 | 13 / 1,777 | 0.7% | September 2025: 5 / 1,560 (0.3%) | +0.4 pp |
Alcohol & substance useShow 2 topics Hide topics 0.6% 0.6% 0.6%0.6% last year
Alcohol-related concernsView figures and history 0.5% 0.5% 0.5%0.6% last year
Alcohol-related concerns
Alcohol-related concerns discussed or assessed, including support with alcohol use.
9 of 1,777 qualifying appointments addressed this concern.
Trailing 12 months: 109 appointments (0.5%) of 20,033.
Exact monthly figures — all saved history
| Month | Topic appointments | Qualifying appointments | Share |
|---|---|---|---|
| June 2025 | 12 | 1,787 | 0.7% |
| July 2025 | 11 | 1,617 | 0.7% |
| August 2025 | 5 | 1,451 | 0.3% |
| September 2025 | 9 | 1,560 | 0.6% |
| October 2025 | 10 | 1,450 | 0.7% |
| November 2025 | 10 | 1,505 | 0.7% |
| December 2025 | 7 | 1,603 | 0.4% |
| January 2026 | 9 | 1,739 | 0.5% |
| February 2026 | 9 | 1,607 | 0.6% |
| March 2026 | 13 | 1,843 | 0.7% |
| April 2026 | 10 | 1,725 | 0.6% |
| May 2026 | 12 | 1,797 | 0.7% |
| June 2026 | 11 | 1,697 | 0.6% |
| July 2026 | 7 | 1,733 | 0.4% |
| August 2026 | 2 | 1,557 | 0.1% |
| September 2026 | 9 | 1,777 | 0.5% |
Seasonal comparisons — matched periods
| Period | Appointments / qualifying | Share | Last year | Change |
|---|---|---|---|---|
| June 2025–August 2025 | 28 / 4,855 | 0.6% | June 2024–August 2024: Unavailable / Unavailable (Unavailable) | — |
| September 2025–November 2025 | 29 / 4,515 | 0.6% | September 2024–November 2024: Unavailable / Unavailable (Unavailable) | — |
| December 2025–February 2026 | 25 / 4,949 | 0.5% | December 2024–February 2025: Unavailable / Unavailable (Unavailable) | — |
| March 2026–May 2026 | 35 / 5,365 | 0.7% | March 2025–May 2025: Unavailable / Unavailable (Unavailable) | — |
| June 2026–August 2026 | 20 / 4,987 | 0.4% | June 2025–August 2025: 28 / 4,855 (0.6%) | -0.2 pp |
| September 2026 | 9 / 1,777 | 0.5% | September 2025: 9 / 1,560 (0.6%) | -0.1 pp |
Other substance useView figures and history 0.1% 0.1% 0.1%0.1% last year
Other substance use
Other substance-use concerns discussed or assessed, including support with drug use.
1 of 1,777 qualifying appointments addressed this concern.
Trailing 12 months: 25 appointments (0.1%) of 20,033.
Exact monthly figures — all saved history
| Month | Topic appointments | Qualifying appointments | Share |
|---|---|---|---|
| June 2025 | 2 | 1,787 | 0.1% |
| July 2025 | 4 | 1,617 | 0.2% |
| August 2025 | 1 | 1,451 | 0.1% |
| September 2025 | 2 | 1,560 | 0.1% |
| October 2025 | 1 | 1,450 | 0.1% |
| November 2025 | 2 | 1,505 | 0.1% |
| December 2025 | 0 | 1,603 | 0.0% |
| January 2026 | 2 | 1,739 | 0.1% |
| February 2026 | 1 | 1,607 | 0.1% |
| March 2026 | 3 | 1,843 | 0.2% |
| April 2026 | 3 | 1,725 | 0.2% |
| May 2026 | 4 | 1,797 | 0.2% |
| June 2026 | 1 | 1,697 | 0.1% |
| July 2026 | 4 | 1,733 | 0.2% |
| August 2026 | 3 | 1,557 | 0.2% |
| September 2026 | 1 | 1,777 | 0.1% |
Seasonal comparisons — matched periods
| Period | Appointments / qualifying | Share | Last year | Change |
|---|---|---|---|---|
| June 2025–August 2025 | 7 / 4,855 | 0.1% | June 2024–August 2024: Unavailable / Unavailable (Unavailable) | — |
| September 2025–November 2025 | 5 / 4,515 | 0.1% | September 2024–November 2024: Unavailable / Unavailable (Unavailable) | — |
| December 2025–February 2026 | 3 / 4,949 | 0.1% | December 2024–February 2025: Unavailable / Unavailable (Unavailable) | — |
| March 2026–May 2026 | 10 / 5,365 | 0.2% | March 2025–May 2025: Unavailable / Unavailable (Unavailable) | — |
| June 2026–August 2026 | 8 / 4,987 | 0.2% | June 2025–August 2025: 7 / 4,855 (0.1%) | 0.0 pp |
| September 2026 | 1 / 1,777 | 0.1% | September 2025: 2 / 1,560 (0.1%) | -0.1 pp |
View trends
Alcohol & substance use
Alcohol-related concerns and other substance-use assessment or support.
10 of 1,777 qualifying appointments addressed this concern.
Trailing 12 months: 125 appointments (0.6%) of 20,033.
Exact monthly figures — all saved history
| Month | Topic appointments | Qualifying appointments | Share |
|---|---|---|---|
| June 2025 | 13 | 1,787 | 0.7% |
| July 2025 | 15 | 1,617 | 0.9% |
| August 2025 | 6 | 1,451 | 0.4% |
| September 2025 | 10 | 1,560 | 0.6% |
| October 2025 | 11 | 1,450 | 0.8% |
| November 2025 | 11 | 1,505 | 0.7% |
| December 2025 | 7 | 1,603 | 0.4% |
| January 2026 | 11 | 1,739 | 0.6% |
| February 2026 | 9 | 1,607 | 0.6% |
| March 2026 | 14 | 1,843 | 0.8% |
| April 2026 | 12 | 1,725 | 0.7% |
| May 2026 | 15 | 1,797 | 0.8% |
| June 2026 | 12 | 1,697 | 0.7% |
| July 2026 | 9 | 1,733 | 0.5% |
| August 2026 | 4 | 1,557 | 0.3% |
| September 2026 | 10 | 1,777 | 0.6% |
Seasonal comparisons — matched periods
| Period | Appointments / qualifying | Share | Last year | Change |
|---|---|---|---|---|
| June 2025–August 2025 | 34 / 4,855 | 0.7% | June 2024–August 2024: Unavailable / Unavailable (Unavailable) | — |
| September 2025–November 2025 | 32 / 4,515 | 0.7% | September 2024–November 2024: Unavailable / Unavailable (Unavailable) | — |
| December 2025–February 2026 | 27 / 4,949 | 0.5% | December 2024–February 2025: Unavailable / Unavailable (Unavailable) | — |
| March 2026–May 2026 | 41 / 5,365 | 0.8% | March 2025–May 2025: Unavailable / Unavailable (Unavailable) | — |
| June 2026–August 2026 | 25 / 4,987 | 0.5% | June 2025–August 2025: 34 / 4,855 (0.7%) | -0.2 pp |
| September 2026 | 10 / 1,777 | 0.6% | September 2025: 10 / 1,560 (0.6%) | -0.1 pp |
ADHDView figures and history 0.6% 0.5% 0.6%0.4% last year
ADHD
Attention deficit hyperactivity disorder (ADHD) specifically discussed or assessed.
10 of 1,777 qualifying appointments addressed this concern.
Trailing 12 months: 95 appointments (0.5%) of 20,033.
Exact monthly figures — all saved history
| Month | Topic appointments | Qualifying appointments | Share |
|---|---|---|---|
| June 2025 | 7 | 1,787 | 0.4% |
| July 2025 | 8 | 1,617 | 0.5% |
| August 2025 | 8 | 1,451 | 0.6% |
| September 2025 | 7 | 1,560 | 0.4% |
| October 2025 | 9 | 1,450 | 0.6% |
| November 2025 | 3 | 1,505 | 0.2% |
| December 2025 | 4 | 1,603 | 0.2% |
| January 2026 | 8 | 1,739 | 0.5% |
| February 2026 | 13 | 1,607 | 0.8% |
| March 2026 | 6 | 1,843 | 0.3% |
| April 2026 | 10 | 1,725 | 0.6% |
| May 2026 | 11 | 1,797 | 0.6% |
| June 2026 | 8 | 1,697 | 0.5% |
| July 2026 | 8 | 1,733 | 0.5% |
| August 2026 | 5 | 1,557 | 0.3% |
| September 2026 | 10 | 1,777 | 0.6% |
Seasonal comparisons — matched periods
| Period | Appointments / qualifying | Share | Last year | Change |
|---|---|---|---|---|
| June 2025–August 2025 | 23 / 4,855 | 0.5% | June 2024–August 2024: Unavailable / Unavailable (Unavailable) | — |
| September 2025–November 2025 | 19 / 4,515 | 0.4% | September 2024–November 2024: Unavailable / Unavailable (Unavailable) | — |
| December 2025–February 2026 | 25 / 4,949 | 0.5% | December 2024–February 2025: Unavailable / Unavailable (Unavailable) | — |
| March 2026–May 2026 | 27 / 5,365 | 0.5% | March 2025–May 2025: Unavailable / Unavailable (Unavailable) | — |
| June 2026–August 2026 | 21 / 4,987 | 0.4% | June 2025–August 2025: 23 / 4,855 (0.5%) | -0.1 pp |
| September 2026 | 10 / 1,777 | 0.6% | September 2025: 7 / 1,560 (0.4%) | +0.1 pp |
OCDView figures and history 0.3% 0.3% 0.3%0.2% last year
OCD
Obsessive compulsive disorder (OCD) specifically discussed or assessed.
6 of 1,777 qualifying appointments addressed this concern.
Trailing 12 months: 69 appointments (0.3%) of 20,033.
Exact monthly figures — all saved history
| Month | Topic appointments | Qualifying appointments | Share |
|---|---|---|---|
| June 2025 | 8 | 1,787 | 0.4% |
| July 2025 | 3 | 1,617 | 0.2% |
| August 2025 | 4 | 1,451 | 0.3% |
| September 2025 | 3 | 1,560 | 0.2% |
| October 2025 | 6 | 1,450 | 0.4% |
| November 2025 | 4 | 1,505 | 0.3% |
| December 2025 | 3 | 1,603 | 0.2% |
| January 2026 | 5 | 1,739 | 0.3% |
| February 2026 | 2 | 1,607 | 0.1% |
| March 2026 | 3 | 1,843 | 0.2% |
| April 2026 | 9 | 1,725 | 0.5% |
| May 2026 | 8 | 1,797 | 0.4% |
| June 2026 | 7 | 1,697 | 0.4% |
| July 2026 | 10 | 1,733 | 0.6% |
| August 2026 | 6 | 1,557 | 0.4% |
| September 2026 | 6 | 1,777 | 0.3% |
Seasonal comparisons — matched periods
| Period | Appointments / qualifying | Share | Last year | Change |
|---|---|---|---|---|
| June 2025–August 2025 | 15 / 4,855 | 0.3% | June 2024–August 2024: Unavailable / Unavailable (Unavailable) | — |
| September 2025–November 2025 | 13 / 4,515 | 0.3% | September 2024–November 2024: Unavailable / Unavailable (Unavailable) | — |
| December 2025–February 2026 | 10 / 4,949 | 0.2% | December 2024–February 2025: Unavailable / Unavailable (Unavailable) | — |
| March 2026–May 2026 | 20 / 5,365 | 0.4% | March 2025–May 2025: Unavailable / Unavailable (Unavailable) | — |
| June 2026–August 2026 | 23 / 4,987 | 0.5% | June 2025–August 2025: 15 / 4,855 (0.3%) | +0.2 pp |
| September 2026 | 6 / 1,777 | 0.3% | September 2025: 3 / 1,560 (0.2%) | +0.1 pp |
Trauma & PTSDView figures and history 0.2% 0.4% 0.2%0.3% last year
Trauma & PTSD
Trauma-related concerns or post-traumatic stress disorder (PTSD) discussed or assessed.
3 of 1,777 qualifying appointments addressed this concern.
Trailing 12 months: 79 appointments (0.4%) of 20,033.
Exact monthly figures — all saved history
| Month | Topic appointments | Qualifying appointments | Share |
|---|---|---|---|
| June 2025 | 5 | 1,787 | 0.3% |
| July 2025 | 6 | 1,617 | 0.4% |
| August 2025 | 1 | 1,451 | 0.1% |
| September 2025 | 4 | 1,560 | 0.3% |
| October 2025 | 4 | 1,450 | 0.3% |
| November 2025 | 8 | 1,505 | 0.5% |
| December 2025 | 8 | 1,603 | 0.5% |
| January 2026 | 7 | 1,739 | 0.4% |
| February 2026 | 11 | 1,607 | 0.7% |
| March 2026 | 6 | 1,843 | 0.3% |
| April 2026 | 11 | 1,725 | 0.6% |
| May 2026 | 5 | 1,797 | 0.3% |
| June 2026 | 6 | 1,697 | 0.4% |
| July 2026 | 5 | 1,733 | 0.3% |
| August 2026 | 5 | 1,557 | 0.3% |
| September 2026 | 3 | 1,777 | 0.2% |
Seasonal comparisons — matched periods
| Period | Appointments / qualifying | Share | Last year | Change |
|---|---|---|---|---|
| June 2025–August 2025 | 12 / 4,855 | 0.2% | June 2024–August 2024: Unavailable / Unavailable (Unavailable) | — |
| September 2025–November 2025 | 16 / 4,515 | 0.4% | September 2024–November 2024: Unavailable / Unavailable (Unavailable) | — |
| December 2025–February 2026 | 26 / 4,949 | 0.5% | December 2024–February 2025: Unavailable / Unavailable (Unavailable) | — |
| March 2026–May 2026 | 22 / 5,365 | 0.4% | March 2025–May 2025: Unavailable / Unavailable (Unavailable) | — |
| June 2026–August 2026 | 16 / 4,987 | 0.3% | June 2025–August 2025: 12 / 4,855 (0.2%) | +0.1 pp |
| September 2026 | 3 / 1,777 | 0.2% | September 2025: 4 / 1,560 (0.3%) | -0.1 pp |
Autism & other neurodevelopmental concernsShow 2 topics Hide topics 0.1% 0.1% 0.1%0.1% last year
Other neurodevelopmental concernsView figures and history 0.1% 0.0% 0.1%0.1% last year
Other neurodevelopmental concerns
Other neurodevelopmental concerns discussed or assessed.
1 of 1,777 qualifying appointments addressed this concern.
Trailing 12 months: 8 appointments (0.0%) of 20,033.
Exact monthly figures — all saved history
| Month | Topic appointments | Qualifying appointments | Share |
|---|---|---|---|
| June 2025 | 1 | 1,787 | 0.1% |
| July 2025 | 0 | 1,617 | 0.0% |
| August 2025 | 1 | 1,451 | 0.1% |
| September 2025 | 1 | 1,560 | 0.1% |
| October 2025 | 1 | 1,450 | 0.1% |
| November 2025 | 0 | 1,505 | 0.0% |
| December 2025 | 2 | 1,603 | 0.1% |
| January 2026 | 0 | 1,739 | 0.0% |
| February 2026 | 1 | 1,607 | 0.1% |
| March 2026 | 1 | 1,843 | 0.1% |
| April 2026 | 2 | 1,725 | 0.1% |
| May 2026 | 0 | 1,797 | 0.0% |
| June 2026 | 0 | 1,697 | 0.0% |
| July 2026 | 0 | 1,733 | 0.0% |
| August 2026 | 0 | 1,557 | 0.0% |
| September 2026 | 1 | 1,777 | 0.1% |
Seasonal comparisons — matched periods
| Period | Appointments / qualifying | Share | Last year | Change |
|---|---|---|---|---|
| June 2025–August 2025 | 2 / 4,855 | 0.0% | June 2024–August 2024: Unavailable / Unavailable (Unavailable) | — |
| September 2025–November 2025 | 2 / 4,515 | 0.0% | September 2024–November 2024: Unavailable / Unavailable (Unavailable) | — |
| December 2025–February 2026 | 3 / 4,949 | 0.1% | December 2024–February 2025: Unavailable / Unavailable (Unavailable) | — |
| March 2026–May 2026 | 3 / 5,365 | 0.1% | March 2025–May 2025: Unavailable / Unavailable (Unavailable) | — |
| June 2026–August 2026 | 0 / 4,987 | 0.0% | June 2025–August 2025: 2 / 4,855 (0.0%) | 0.0 pp |
| September 2026 | 1 / 1,777 | 0.1% | September 2025: 1 / 1,560 (0.1%) | 0.0 pp |
AutismView figures and history 0.0% 0.1% 0.0%0.0% last year
Autism
Appointments where autism was specifically discussed or assessed.
0 of 1,777 qualifying appointments addressed this concern.
Trailing 12 months: 13 appointments (0.1%) of 20,033.
Exact monthly figures — all saved history
| Month | Topic appointments | Qualifying appointments | Share |
|---|---|---|---|
| June 2025 | 1 | 1,787 | 0.1% |
| July 2025 | 0 | 1,617 | 0.0% |
| August 2025 | 1 | 1,451 | 0.1% |
| September 2025 | 0 | 1,560 | 0.0% |
| October 2025 | 1 | 1,450 | 0.1% |
| November 2025 | 0 | 1,505 | 0.0% |
| December 2025 | 2 | 1,603 | 0.1% |
| January 2026 | 0 | 1,739 | 0.0% |
| February 2026 | 1 | 1,607 | 0.1% |
| March 2026 | 1 | 1,843 | 0.1% |
| April 2026 | 4 | 1,725 | 0.2% |
| May 2026 | 1 | 1,797 | 0.1% |
| June 2026 | 0 | 1,697 | 0.0% |
| July 2026 | 0 | 1,733 | 0.0% |
| August 2026 | 3 | 1,557 | 0.2% |
| September 2026 | 0 | 1,777 | 0.0% |
Seasonal comparisons — matched periods
| Period | Appointments / qualifying | Share | Last year | Change |
|---|---|---|---|---|
| June 2025–August 2025 | 2 / 4,855 | 0.0% | June 2024–August 2024: Unavailable / Unavailable (Unavailable) | — |
| September 2025–November 2025 | 1 / 4,515 | 0.0% | September 2024–November 2024: Unavailable / Unavailable (Unavailable) | — |
| December 2025–February 2026 | 3 / 4,949 | 0.1% | December 2024–February 2025: Unavailable / Unavailable (Unavailable) | — |
| March 2026–May 2026 | 6 / 5,365 | 0.1% | March 2025–May 2025: Unavailable / Unavailable (Unavailable) | — |
| June 2026–August 2026 | 3 / 4,987 | 0.1% | June 2025–August 2025: 2 / 4,855 (0.0%) | 0.0 pp |
| September 2026 | 0 / 1,777 | 0.0% | September 2025: 0 / 1,560 (0.0%) | 0.0 pp |
View trends
Autism & other neurodevelopmental concerns
Autism and other neurodevelopmental concerns specifically discussed or assessed.
1 of 1,777 qualifying appointments addressed this concern.
Trailing 12 months: 21 appointments (0.1%) of 20,033.
Exact monthly figures — all saved history
| Month | Topic appointments | Qualifying appointments | Share |
|---|---|---|---|
| June 2025 | 2 | 1,787 | 0.1% |
| July 2025 | 0 | 1,617 | 0.0% |
| August 2025 | 2 | 1,451 | 0.1% |
| September 2025 | 1 | 1,560 | 0.1% |
| October 2025 | 2 | 1,450 | 0.1% |
| November 2025 | 0 | 1,505 | 0.0% |
| December 2025 | 4 | 1,603 | 0.2% |
| January 2026 | 0 | 1,739 | 0.0% |
| February 2026 | 2 | 1,607 | 0.1% |
| March 2026 | 2 | 1,843 | 0.1% |
| April 2026 | 6 | 1,725 | 0.3% |
| May 2026 | 1 | 1,797 | 0.1% |
| June 2026 | 0 | 1,697 | 0.0% |
| July 2026 | 0 | 1,733 | 0.0% |
| August 2026 | 3 | 1,557 | 0.2% |
| September 2026 | 1 | 1,777 | 0.1% |
Seasonal comparisons — matched periods
| Period | Appointments / qualifying | Share | Last year | Change |
|---|---|---|---|---|
| June 2025–August 2025 | 4 / 4,855 | 0.1% | June 2024–August 2024: Unavailable / Unavailable (Unavailable) | — |
| September 2025–November 2025 | 3 / 4,515 | 0.1% | September 2024–November 2024: Unavailable / Unavailable (Unavailable) | — |
| December 2025–February 2026 | 6 / 4,949 | 0.1% | December 2024–February 2025: Unavailable / Unavailable (Unavailable) | — |
| March 2026–May 2026 | 9 / 5,365 | 0.2% | March 2025–May 2025: Unavailable / Unavailable (Unavailable) | — |
| June 2026–August 2026 | 3 / 4,987 | 0.1% | June 2025–August 2025: 4 / 4,855 (0.1%) | 0.0 pp |
| September 2026 | 1 / 1,777 | 0.1% | September 2025: 1 / 1,560 (0.1%) | 0.0 pp |
Eating disordersView figures and history 0.0% 0.1% 0.0%0.1% last year
Eating disorders
Eating disorder concerns discussed or assessed.
0 of 1,777 qualifying appointments addressed this concern.
Trailing 12 months: 25 appointments (0.1%) of 20,033.
Exact monthly figures — all saved history
| Month | Topic appointments | Qualifying appointments | Share |
|---|---|---|---|
| June 2025 | 1 | 1,787 | 0.1% |
| July 2025 | 0 | 1,617 | 0.0% |
| August 2025 | 0 | 1,451 | 0.0% |
| September 2025 | 1 | 1,560 | 0.1% |
| October 2025 | 0 | 1,450 | 0.0% |
| November 2025 | 5 | 1,505 | 0.3% |
| December 2025 | 2 | 1,603 | 0.1% |
| January 2026 | 5 | 1,739 | 0.3% |
| February 2026 | 2 | 1,607 | 0.1% |
| March 2026 | 3 | 1,843 | 0.2% |
| April 2026 | 3 | 1,725 | 0.2% |
| May 2026 | 4 | 1,797 | 0.2% |
| June 2026 | 0 | 1,697 | 0.0% |
| July 2026 | 0 | 1,733 | 0.0% |
| August 2026 | 1 | 1,557 | 0.1% |
| September 2026 | 0 | 1,777 | 0.0% |
Seasonal comparisons — matched periods
| Period | Appointments / qualifying | Share | Last year | Change |
|---|---|---|---|---|
| June 2025–August 2025 | 1 / 4,855 | 0.0% | June 2024–August 2024: Unavailable / Unavailable (Unavailable) | — |
| September 2025–November 2025 | 6 / 4,515 | 0.1% | September 2024–November 2024: Unavailable / Unavailable (Unavailable) | — |
| December 2025–February 2026 | 9 / 4,949 | 0.2% | December 2024–February 2025: Unavailable / Unavailable (Unavailable) | — |
| March 2026–May 2026 | 10 / 5,365 | 0.2% | March 2025–May 2025: Unavailable / Unavailable (Unavailable) | — |
| June 2026–August 2026 | 1 / 4,987 | 0.0% | June 2025–August 2025: 1 / 4,855 (0.0%) | 0.0 pp |
| September 2026 | 0 / 1,777 | 0.0% | September 2025: 1 / 1,560 (0.1%) | -0.1 pp |
View trends
Mental health & wellbeing
Mental health, sleep, attention, neurodevelopmental and substance-use concerns.
289 of 1,777 qualifying appointments addressed this concern.
Trailing 12 months: 3,344 appointments (16.7%) of 20,033.
Exact monthly figures — all saved history
| Month | Topic appointments | Qualifying appointments | Share |
|---|---|---|---|
| June 2025 | 257 | 1,787 | 14.4% |
| July 2025 | 218 | 1,617 | 13.5% |
| August 2025 | 240 | 1,451 | 16.5% |
| September 2025 | 226 | 1,560 | 14.5% |
| October 2025 | 227 | 1,450 | 15.7% |
| November 2025 | 250 | 1,505 | 16.6% |
| December 2025 | 252 | 1,603 | 15.7% |
| January 2026 | 277 | 1,739 | 15.9% |
| February 2026 | 259 | 1,607 | 16.1% |
| March 2026 | 279 | 1,843 | 15.1% |
| April 2026 | 294 | 1,725 | 17.0% |
| May 2026 | 375 | 1,797 | 20.9% |
| June 2026 | 274 | 1,697 | 16.1% |
| July 2026 | 298 | 1,733 | 17.2% |
| August 2026 | 270 | 1,557 | 17.3% |
| September 2026 | 289 | 1,777 | 16.3% |
Seasonal comparisons — matched periods
| Period | Appointments / qualifying | Share | Last year | Change |
|---|---|---|---|---|
| June 2025–August 2025 | 715 / 4,855 | 14.7% | June 2024–August 2024: Unavailable / Unavailable (Unavailable) | — |
| September 2025–November 2025 | 703 / 4,515 | 15.6% | September 2024–November 2024: Unavailable / Unavailable (Unavailable) | — |
| December 2025–February 2026 | 788 / 4,949 | 15.9% | December 2024–February 2025: Unavailable / Unavailable (Unavailable) | — |
| March 2026–May 2026 | 948 / 5,365 | 17.7% | March 2025–May 2025: Unavailable / Unavailable (Unavailable) | — |
| June 2026–August 2026 | 842 / 4,987 | 16.9% | June 2025–August 2025: 715 / 4,855 (14.7%) | +2.2 pp |
| September 2026 | 289 / 1,777 | 16.3% | September 2025: 226 / 1,560 (14.5%) | +1.8 pp |
SkinShow 8 topics Hide topics 15.6% 14.6% 15.6%15.7% last year
Skin infections & infestationsShow 5 topics Hide topics 6.8% 5.8% 6.8%7.3% last year
Bacterial skin infectionsView figures and history 3.5% 2.8% 3.5%3.7% last year
Bacterial skin infections
Bacterial skin infection concerns discussed or assessed.
62 of 1,777 qualifying appointments addressed this concern.
Trailing 12 months: 569 appointments (2.8%) of 20,033.
Exact monthly figures — all saved history
| Month | Topic appointments | Qualifying appointments | Share |
|---|---|---|---|
| June 2025 | 72 | 1,787 | 4.0% |
| July 2025 | 43 | 1,617 | 2.7% |
| August 2025 | 51 | 1,451 | 3.5% |
| September 2025 | 58 | 1,560 | 3.7% |
| October 2025 | 45 | 1,450 | 3.1% |
| November 2025 | 38 | 1,505 | 2.5% |
| December 2025 | 49 | 1,603 | 3.1% |
| January 2026 | 37 | 1,739 | 2.1% |
| February 2026 | 46 | 1,607 | 2.9% |
| March 2026 | 53 | 1,843 | 2.9% |
| April 2026 | 49 | 1,725 | 2.8% |
| May 2026 | 50 | 1,797 | 2.8% |
| June 2026 | 43 | 1,697 | 2.5% |
| July 2026 | 50 | 1,733 | 2.9% |
| August 2026 | 47 | 1,557 | 3.0% |
| September 2026 | 62 | 1,777 | 3.5% |
Seasonal comparisons — matched periods
| Period | Appointments / qualifying | Share | Last year | Change |
|---|---|---|---|---|
| June 2025–August 2025 | 166 / 4,855 | 3.4% | June 2024–August 2024: Unavailable / Unavailable (Unavailable) | — |
| September 2025–November 2025 | 141 / 4,515 | 3.1% | September 2024–November 2024: Unavailable / Unavailable (Unavailable) | — |
| December 2025–February 2026 | 132 / 4,949 | 2.7% | December 2024–February 2025: Unavailable / Unavailable (Unavailable) | — |
| March 2026–May 2026 | 152 / 5,365 | 2.8% | March 2025–May 2025: Unavailable / Unavailable (Unavailable) | — |
| June 2026–August 2026 | 140 / 4,987 | 2.8% | June 2025–August 2025: 166 / 4,855 (3.4%) | -0.6 pp |
| September 2026 | 62 / 1,777 | 3.5% | September 2025: 58 / 1,560 (3.7%) | -0.2 pp |
Fungal skin infectionsView figures and history 2.0% 1.5% 2.0%1.5% last year
Fungal skin infections
Fungal skin infection concerns discussed or assessed.
35 of 1,777 qualifying appointments addressed this concern.
Trailing 12 months: 298 appointments (1.5%) of 20,033.
Exact monthly figures — all saved history
| Month | Topic appointments | Qualifying appointments | Share |
|---|---|---|---|
| June 2025 | 23 | 1,787 | 1.3% |
| July 2025 | 35 | 1,617 | 2.2% |
| August 2025 | 30 | 1,451 | 2.1% |
| September 2025 | 24 | 1,560 | 1.5% |
| October 2025 | 17 | 1,450 | 1.2% |
| November 2025 | 13 | 1,505 | 0.9% |
| December 2025 | 15 | 1,603 | 0.9% |
| January 2026 | 25 | 1,739 | 1.4% |
| February 2026 | 30 | 1,607 | 1.9% |
| March 2026 | 30 | 1,843 | 1.6% |
| April 2026 | 28 | 1,725 | 1.6% |
| May 2026 | 28 | 1,797 | 1.6% |
| June 2026 | 26 | 1,697 | 1.5% |
| July 2026 | 30 | 1,733 | 1.7% |
| August 2026 | 21 | 1,557 | 1.3% |
| September 2026 | 35 | 1,777 | 2.0% |
Seasonal comparisons — matched periods
| Period | Appointments / qualifying | Share | Last year | Change |
|---|---|---|---|---|
| June 2025–August 2025 | 88 / 4,855 | 1.8% | June 2024–August 2024: Unavailable / Unavailable (Unavailable) | — |
| September 2025–November 2025 | 54 / 4,515 | 1.2% | September 2024–November 2024: Unavailable / Unavailable (Unavailable) | — |
| December 2025–February 2026 | 70 / 4,949 | 1.4% | December 2024–February 2025: Unavailable / Unavailable (Unavailable) | — |
| March 2026–May 2026 | 86 / 5,365 | 1.6% | March 2025–May 2025: Unavailable / Unavailable (Unavailable) | — |
| June 2026–August 2026 | 77 / 4,987 | 1.5% | June 2025–August 2025: 88 / 4,855 (1.8%) | -0.3 pp |
| September 2026 | 35 / 1,777 | 2.0% | September 2025: 24 / 1,560 (1.5%) | +0.4 pp |
Other viral skin infectionsView figures and history 1.0% 1.0% 1.0%0.8% last year
Other viral skin infections
Other viral skin infection concerns.
17 of 1,777 qualifying appointments addressed this concern.
Trailing 12 months: 194 appointments (1.0%) of 20,033.
Exact monthly figures — all saved history
| Month | Topic appointments | Qualifying appointments | Share |
|---|---|---|---|
| June 2025 | 10 | 1,787 | 0.6% |
| July 2025 | 21 | 1,617 | 1.3% |
| August 2025 | 14 | 1,451 | 1.0% |
| September 2025 | 13 | 1,560 | 0.8% |
| October 2025 | 14 | 1,450 | 1.0% |
| November 2025 | 23 | 1,505 | 1.5% |
| December 2025 | 14 | 1,603 | 0.9% |
| January 2026 | 9 | 1,739 | 0.5% |
| February 2026 | 13 | 1,607 | 0.8% |
| March 2026 | 22 | 1,843 | 1.2% |
| April 2026 | 18 | 1,725 | 1.0% |
| May 2026 | 15 | 1,797 | 0.8% |
| June 2026 | 19 | 1,697 | 1.1% |
| July 2026 | 15 | 1,733 | 0.9% |
| August 2026 | 15 | 1,557 | 1.0% |
| September 2026 | 17 | 1,777 | 1.0% |
Seasonal comparisons — matched periods
| Period | Appointments / qualifying | Share | Last year | Change |
|---|---|---|---|---|
| June 2025–August 2025 | 45 / 4,855 | 0.9% | June 2024–August 2024: Unavailable / Unavailable (Unavailable) | — |
| September 2025–November 2025 | 50 / 4,515 | 1.1% | September 2024–November 2024: Unavailable / Unavailable (Unavailable) | — |
| December 2025–February 2026 | 36 / 4,949 | 0.7% | December 2024–February 2025: Unavailable / Unavailable (Unavailable) | — |
| March 2026–May 2026 | 55 / 5,365 | 1.0% | March 2025–May 2025: Unavailable / Unavailable (Unavailable) | — |
| June 2026–August 2026 | 49 / 4,987 | 1.0% | June 2025–August 2025: 45 / 4,855 (0.9%) | +0.1 pp |
| September 2026 | 17 / 1,777 | 1.0% | September 2025: 13 / 1,560 (0.8%) | +0.1 pp |
ShinglesView figures and history 0.7% 0.5% 0.7%0.6% last year
Shingles
Shingles specifically discussed or assessed.
12 of 1,777 qualifying appointments addressed this concern.
Trailing 12 months: 101 appointments (0.5%) of 20,033.
Exact monthly figures — all saved history
| Month | Topic appointments | Qualifying appointments | Share |
|---|---|---|---|
| June 2025 | 12 | 1,787 | 0.7% |
| July 2025 | 13 | 1,617 | 0.8% |
| August 2025 | 7 | 1,451 | 0.5% |
| September 2025 | 10 | 1,560 | 0.6% |
| October 2025 | 10 | 1,450 | 0.7% |
| November 2025 | 4 | 1,505 | 0.3% |
| December 2025 | 5 | 1,603 | 0.3% |
| January 2026 | 4 | 1,739 | 0.2% |
| February 2026 | 11 | 1,607 | 0.7% |
| March 2026 | 10 | 1,843 | 0.5% |
| April 2026 | 3 | 1,725 | 0.2% |
| May 2026 | 8 | 1,797 | 0.4% |
| June 2026 | 10 | 1,697 | 0.6% |
| July 2026 | 14 | 1,733 | 0.8% |
| August 2026 | 10 | 1,557 | 0.6% |
| September 2026 | 12 | 1,777 | 0.7% |
Seasonal comparisons — matched periods
| Period | Appointments / qualifying | Share | Last year | Change |
|---|---|---|---|---|
| June 2025–August 2025 | 32 / 4,855 | 0.7% | June 2024–August 2024: Unavailable / Unavailable (Unavailable) | — |
| September 2025–November 2025 | 24 / 4,515 | 0.5% | September 2024–November 2024: Unavailable / Unavailable (Unavailable) | — |
| December 2025–February 2026 | 20 / 4,949 | 0.4% | December 2024–February 2025: Unavailable / Unavailable (Unavailable) | — |
| March 2026–May 2026 | 21 / 5,365 | 0.4% | March 2025–May 2025: Unavailable / Unavailable (Unavailable) | — |
| June 2026–August 2026 | 34 / 4,987 | 0.7% | June 2025–August 2025: 32 / 4,855 (0.7%) | 0.0 pp |
| September 2026 | 12 / 1,777 | 0.7% | September 2025: 10 / 1,560 (0.6%) | 0.0 pp |
Scabies/other infestationsView figures and history 0.3% 0.3% 0.3%0.8% last year
Scabies/other infestations
Scabies or other skin infestations discussed or assessed.
5 of 1,777 qualifying appointments addressed this concern.
Trailing 12 months: 70 appointments (0.3%) of 20,033.
Exact monthly figures — all saved history
| Month | Topic appointments | Qualifying appointments | Share |
|---|---|---|---|
| June 2025 | 9 | 1,787 | 0.5% |
| July 2025 | 9 | 1,617 | 0.6% |
| August 2025 | 8 | 1,451 | 0.6% |
| September 2025 | 13 | 1,560 | 0.8% |
| October 2025 | 8 | 1,450 | 0.6% |
| November 2025 | 9 | 1,505 | 0.6% |
| December 2025 | 3 | 1,603 | 0.2% |
| January 2026 | 3 | 1,739 | 0.2% |
| February 2026 | 11 | 1,607 | 0.7% |
| March 2026 | 8 | 1,843 | 0.4% |
| April 2026 | 6 | 1,725 | 0.3% |
| May 2026 | 8 | 1,797 | 0.4% |
| June 2026 | 3 | 1,697 | 0.2% |
| July 2026 | 3 | 1,733 | 0.2% |
| August 2026 | 3 | 1,557 | 0.2% |
| September 2026 | 5 | 1,777 | 0.3% |
Seasonal comparisons — matched periods
| Period | Appointments / qualifying | Share | Last year | Change |
|---|---|---|---|---|
| June 2025–August 2025 | 26 / 4,855 | 0.5% | June 2024–August 2024: Unavailable / Unavailable (Unavailable) | — |
| September 2025–November 2025 | 30 / 4,515 | 0.7% | September 2024–November 2024: Unavailable / Unavailable (Unavailable) | — |
| December 2025–February 2026 | 17 / 4,949 | 0.3% | December 2024–February 2025: Unavailable / Unavailable (Unavailable) | — |
| March 2026–May 2026 | 22 / 5,365 | 0.4% | March 2025–May 2025: Unavailable / Unavailable (Unavailable) | — |
| June 2026–August 2026 | 9 / 4,987 | 0.2% | June 2025–August 2025: 26 / 4,855 (0.5%) | -0.4 pp |
| September 2026 | 5 / 1,777 | 0.3% | September 2025: 13 / 1,560 (0.8%) | -0.6 pp |
View trends
Skin infections & infestations
Bacterial, fungal or viral skin infections, and skin infestations.
120 of 1,777 qualifying appointments addressed this concern.
Trailing 12 months: 1,155 appointments (5.8%) of 20,033.
Exact monthly figures — all saved history
| Month | Topic appointments | Qualifying appointments | Share |
|---|---|---|---|
| June 2025 | 123 | 1,787 | 6.9% |
| July 2025 | 112 | 1,617 | 6.9% |
| August 2025 | 106 | 1,451 | 7.3% |
| September 2025 | 114 | 1,560 | 7.3% |
| October 2025 | 83 | 1,450 | 5.7% |
| November 2025 | 78 | 1,505 | 5.2% |
| December 2025 | 80 | 1,603 | 5.0% |
| January 2026 | 72 | 1,739 | 4.1% |
| February 2026 | 104 | 1,607 | 6.5% |
| March 2026 | 118 | 1,843 | 6.4% |
| April 2026 | 101 | 1,725 | 5.9% |
| May 2026 | 106 | 1,797 | 5.9% |
| June 2026 | 96 | 1,697 | 5.7% |
| July 2026 | 106 | 1,733 | 6.1% |
| August 2026 | 91 | 1,557 | 5.8% |
| September 2026 | 120 | 1,777 | 6.8% |
Seasonal comparisons — matched periods
| Period | Appointments / qualifying | Share | Last year | Change |
|---|---|---|---|---|
| June 2025–August 2025 | 341 / 4,855 | 7.0% | June 2024–August 2024: Unavailable / Unavailable (Unavailable) | — |
| September 2025–November 2025 | 275 / 4,515 | 6.1% | September 2024–November 2024: Unavailable / Unavailable (Unavailable) | — |
| December 2025–February 2026 | 256 / 4,949 | 5.2% | December 2024–February 2025: Unavailable / Unavailable (Unavailable) | — |
| March 2026–May 2026 | 325 / 5,365 | 6.1% | March 2025–May 2025: Unavailable / Unavailable (Unavailable) | — |
| June 2026–August 2026 | 293 / 4,987 | 5.9% | June 2025–August 2025: 341 / 4,855 (7.0%) | -1.1 pp |
| September 2026 | 120 / 1,777 | 6.8% | September 2025: 114 / 1,560 (7.3%) | -0.6 pp |
Moles, lumps & skin lesionsShow 2 topics Hide topics 3.4% 3.3% 3.4%3.5% last year
Other skin lumps & lesionsView figures and history 2.1% 2.3% 2.1%2.6% last year
Other skin lumps & lesions
Other skin lumps or lesions, including cysts and lipomas.
38 of 1,777 qualifying appointments addressed this concern.
Trailing 12 months: 461 appointments (2.3%) of 20,033.
Exact monthly figures — all saved history
| Month | Topic appointments | Qualifying appointments | Share |
|---|---|---|---|
| June 2025 | 41 | 1,787 | 2.3% |
| July 2025 | 41 | 1,617 | 2.5% |
| August 2025 | 46 | 1,451 | 3.2% |
| September 2025 | 40 | 1,560 | 2.6% |
| October 2025 | 37 | 1,450 | 2.6% |
| November 2025 | 29 | 1,505 | 1.9% |
| December 2025 | 36 | 1,603 | 2.2% |
| January 2026 | 40 | 1,739 | 2.3% |
| February 2026 | 29 | 1,607 | 1.8% |
| March 2026 | 49 | 1,843 | 2.7% |
| April 2026 | 44 | 1,725 | 2.6% |
| May 2026 | 34 | 1,797 | 1.9% |
| June 2026 | 44 | 1,697 | 2.6% |
| July 2026 | 42 | 1,733 | 2.4% |
| August 2026 | 39 | 1,557 | 2.5% |
| September 2026 | 38 | 1,777 | 2.1% |
Seasonal comparisons — matched periods
| Period | Appointments / qualifying | Share | Last year | Change |
|---|---|---|---|---|
| June 2025–August 2025 | 128 / 4,855 | 2.6% | June 2024–August 2024: Unavailable / Unavailable (Unavailable) | — |
| September 2025–November 2025 | 106 / 4,515 | 2.3% | September 2024–November 2024: Unavailable / Unavailable (Unavailable) | — |
| December 2025–February 2026 | 105 / 4,949 | 2.1% | December 2024–February 2025: Unavailable / Unavailable (Unavailable) | — |
| March 2026–May 2026 | 127 / 5,365 | 2.4% | March 2025–May 2025: Unavailable / Unavailable (Unavailable) | — |
| June 2026–August 2026 | 125 / 4,987 | 2.5% | June 2025–August 2025: 128 / 4,855 (2.6%) | -0.1 pp |
| September 2026 | 38 / 1,777 | 2.1% | September 2025: 40 / 1,560 (2.6%) | -0.4 pp |
Mole/pigmented-lesion concernsView figures and history 1.4% 1.1% 1.4%1.2% last year
Mole/pigmented-lesion concerns
Moles or other pigmented skin lesions assessed at the appointment.
25 of 1,777 qualifying appointments addressed this concern.
Trailing 12 months: 223 appointments (1.1%) of 20,033.
Exact monthly figures — all saved history
| Month | Topic appointments | Qualifying appointments | Share |
|---|---|---|---|
| June 2025 | 27 | 1,787 | 1.5% |
| July 2025 | 32 | 1,617 | 2.0% |
| August 2025 | 21 | 1,451 | 1.4% |
| September 2025 | 18 | 1,560 | 1.2% |
| October 2025 | 15 | 1,450 | 1.0% |
| November 2025 | 13 | 1,505 | 0.9% |
| December 2025 | 12 | 1,603 | 0.7% |
| January 2026 | 16 | 1,739 | 0.9% |
| February 2026 | 14 | 1,607 | 0.9% |
| March 2026 | 28 | 1,843 | 1.5% |
| April 2026 | 17 | 1,725 | 1.0% |
| May 2026 | 14 | 1,797 | 0.8% |
| June 2026 | 22 | 1,697 | 1.3% |
| July 2026 | 24 | 1,733 | 1.4% |
| August 2026 | 23 | 1,557 | 1.5% |
| September 2026 | 25 | 1,777 | 1.4% |
Seasonal comparisons — matched periods
| Period | Appointments / qualifying | Share | Last year | Change |
|---|---|---|---|---|
| June 2025–August 2025 | 80 / 4,855 | 1.6% | June 2024–August 2024: Unavailable / Unavailable (Unavailable) | — |
| September 2025–November 2025 | 46 / 4,515 | 1.0% | September 2024–November 2024: Unavailable / Unavailable (Unavailable) | — |
| December 2025–February 2026 | 42 / 4,949 | 0.8% | December 2024–February 2025: Unavailable / Unavailable (Unavailable) | — |
| March 2026–May 2026 | 59 / 5,365 | 1.1% | March 2025–May 2025: Unavailable / Unavailable (Unavailable) | — |
| June 2026–August 2026 | 69 / 4,987 | 1.4% | June 2025–August 2025: 80 / 4,855 (1.6%) | -0.3 pp |
| September 2026 | 25 / 1,777 | 1.4% | September 2025: 18 / 1,560 (1.2%) | +0.3 pp |
View trends
Moles, lumps & skin lesions
Moles, pigmented lesions, skin lumps and other skin lesions assessed at the appointment.
60 of 1,777 qualifying appointments addressed this concern.
Trailing 12 months: 656 appointments (3.3%) of 20,033.
Exact monthly figures — all saved history
| Month | Topic appointments | Qualifying appointments | Share |
|---|---|---|---|
| June 2025 | 66 | 1,787 | 3.7% |
| July 2025 | 66 | 1,617 | 4.1% |
| August 2025 | 65 | 1,451 | 4.5% |
| September 2025 | 55 | 1,560 | 3.5% |
| October 2025 | 50 | 1,450 | 3.4% |
| November 2025 | 41 | 1,505 | 2.7% |
| December 2025 | 44 | 1,603 | 2.7% |
| January 2026 | 56 | 1,739 | 3.2% |
| February 2026 | 41 | 1,607 | 2.6% |
| March 2026 | 76 | 1,843 | 4.1% |
| April 2026 | 57 | 1,725 | 3.3% |
| May 2026 | 46 | 1,797 | 2.6% |
| June 2026 | 62 | 1,697 | 3.7% |
| July 2026 | 64 | 1,733 | 3.7% |
| August 2026 | 59 | 1,557 | 3.8% |
| September 2026 | 60 | 1,777 | 3.4% |
Seasonal comparisons — matched periods
| Period | Appointments / qualifying | Share | Last year | Change |
|---|---|---|---|---|
| June 2025–August 2025 | 197 / 4,855 | 4.1% | June 2024–August 2024: Unavailable / Unavailable (Unavailable) | — |
| September 2025–November 2025 | 146 / 4,515 | 3.2% | September 2024–November 2024: Unavailable / Unavailable (Unavailable) | — |
| December 2025–February 2026 | 141 / 4,949 | 2.8% | December 2024–February 2025: Unavailable / Unavailable (Unavailable) | — |
| March 2026–May 2026 | 179 / 5,365 | 3.3% | March 2025–May 2025: Unavailable / Unavailable (Unavailable) | — |
| June 2026–August 2026 | 185 / 4,987 | 3.7% | June 2025–August 2025: 197 / 4,855 (4.1%) | -0.3 pp |
| September 2026 | 60 / 1,777 | 3.4% | September 2025: 55 / 1,560 (3.5%) | -0.1 pp |
Other rashes, itching & skin concernsShow 2 topics Hide topics 2.5% 2.5% 2.5%2.1% last year
Unspecified rash/itchingView figures and history 1.5% 1.5% 1.5%1.2% last year
Unspecified rash/itching
Rash or itching without a more specific recorded skin diagnosis.
27 of 1,777 qualifying appointments addressed this concern.
Trailing 12 months: 309 appointments (1.5%) of 20,033.
Exact monthly figures — all saved history
| Month | Topic appointments | Qualifying appointments | Share |
|---|---|---|---|
| June 2025 | 36 | 1,787 | 2.0% |
| July 2025 | 31 | 1,617 | 1.9% |
| August 2025 | 20 | 1,451 | 1.4% |
| September 2025 | 18 | 1,560 | 1.2% |
| October 2025 | 14 | 1,450 | 1.0% |
| November 2025 | 23 | 1,505 | 1.5% |
| December 2025 | 29 | 1,603 | 1.8% |
| January 2026 | 17 | 1,739 | 1.0% |
| February 2026 | 23 | 1,607 | 1.4% |
| March 2026 | 28 | 1,843 | 1.5% |
| April 2026 | 31 | 1,725 | 1.8% |
| May 2026 | 30 | 1,797 | 1.7% |
| June 2026 | 27 | 1,697 | 1.6% |
| July 2026 | 34 | 1,733 | 2.0% |
| August 2026 | 26 | 1,557 | 1.7% |
| September 2026 | 27 | 1,777 | 1.5% |
Seasonal comparisons — matched periods
| Period | Appointments / qualifying | Share | Last year | Change |
|---|---|---|---|---|
| June 2025–August 2025 | 87 / 4,855 | 1.8% | June 2024–August 2024: Unavailable / Unavailable (Unavailable) | — |
| September 2025–November 2025 | 55 / 4,515 | 1.2% | September 2024–November 2024: Unavailable / Unavailable (Unavailable) | — |
| December 2025–February 2026 | 69 / 4,949 | 1.4% | December 2024–February 2025: Unavailable / Unavailable (Unavailable) | — |
| March 2026–May 2026 | 89 / 5,365 | 1.7% | March 2025–May 2025: Unavailable / Unavailable (Unavailable) | — |
| June 2026–August 2026 | 87 / 4,987 | 1.7% | June 2025–August 2025: 87 / 4,855 (1.8%) | 0.0 pp |
| September 2026 | 27 / 1,777 | 1.5% | September 2025: 18 / 1,560 (1.2%) | +0.4 pp |
Other skin concernsView figures and history 1.0% 1.0% 1.0%0.9% last year
Other skin concerns
Other skin concerns without a more specific recorded category.
17 of 1,777 qualifying appointments addressed this concern.
Trailing 12 months: 197 appointments (1.0%) of 20,033.
Exact monthly figures — all saved history
| Month | Topic appointments | Qualifying appointments | Share |
|---|---|---|---|
| June 2025 | 21 | 1,787 | 1.2% |
| July 2025 | 13 | 1,617 | 0.8% |
| August 2025 | 18 | 1,451 | 1.2% |
| September 2025 | 14 | 1,560 | 0.9% |
| October 2025 | 15 | 1,450 | 1.0% |
| November 2025 | 13 | 1,505 | 0.9% |
| December 2025 | 14 | 1,603 | 0.9% |
| January 2026 | 20 | 1,739 | 1.2% |
| February 2026 | 18 | 1,607 | 1.1% |
| March 2026 | 21 | 1,843 | 1.1% |
| April 2026 | 15 | 1,725 | 0.9% |
| May 2026 | 18 | 1,797 | 1.0% |
| June 2026 | 17 | 1,697 | 1.0% |
| July 2026 | 18 | 1,733 | 1.0% |
| August 2026 | 11 | 1,557 | 0.7% |
| September 2026 | 17 | 1,777 | 1.0% |
Seasonal comparisons — matched periods
| Period | Appointments / qualifying | Share | Last year | Change |
|---|---|---|---|---|
| June 2025–August 2025 | 52 / 4,855 | 1.1% | June 2024–August 2024: Unavailable / Unavailable (Unavailable) | — |
| September 2025–November 2025 | 42 / 4,515 | 0.9% | September 2024–November 2024: Unavailable / Unavailable (Unavailable) | — |
| December 2025–February 2026 | 52 / 4,949 | 1.1% | December 2024–February 2025: Unavailable / Unavailable (Unavailable) | — |
| March 2026–May 2026 | 54 / 5,365 | 1.0% | March 2025–May 2025: Unavailable / Unavailable (Unavailable) | — |
| June 2026–August 2026 | 46 / 4,987 | 0.9% | June 2025–August 2025: 52 / 4,855 (1.1%) | -0.1 pp |
| September 2026 | 17 / 1,777 | 1.0% | September 2025: 14 / 1,560 (0.9%) | +0.1 pp |
View trends
Other rashes, itching & skin concerns
Rashes, itching and other skin concerns without a more specific recorded category.
44 of 1,777 qualifying appointments addressed this concern.
Trailing 12 months: 503 appointments (2.5%) of 20,033.
Exact monthly figures — all saved history
| Month | Topic appointments | Qualifying appointments | Share |
|---|---|---|---|
| June 2025 | 56 | 1,787 | 3.1% |
| July 2025 | 43 | 1,617 | 2.7% |
| August 2025 | 38 | 1,451 | 2.6% |
| September 2025 | 32 | 1,560 | 2.1% |
| October 2025 | 29 | 1,450 | 2.0% |
| November 2025 | 35 | 1,505 | 2.3% |
| December 2025 | 43 | 1,603 | 2.7% |
| January 2026 | 37 | 1,739 | 2.1% |
| February 2026 | 41 | 1,607 | 2.6% |
| March 2026 | 47 | 1,843 | 2.6% |
| April 2026 | 46 | 1,725 | 2.7% |
| May 2026 | 48 | 1,797 | 2.7% |
| June 2026 | 44 | 1,697 | 2.6% |
| July 2026 | 52 | 1,733 | 3.0% |
| August 2026 | 37 | 1,557 | 2.4% |
| September 2026 | 44 | 1,777 | 2.5% |
Seasonal comparisons — matched periods
| Period | Appointments / qualifying | Share | Last year | Change |
|---|---|---|---|---|
| June 2025–August 2025 | 137 / 4,855 | 2.8% | June 2024–August 2024: Unavailable / Unavailable (Unavailable) | — |
| September 2025–November 2025 | 96 / 4,515 | 2.1% | September 2024–November 2024: Unavailable / Unavailable (Unavailable) | — |
| December 2025–February 2026 | 121 / 4,949 | 2.4% | December 2024–February 2025: Unavailable / Unavailable (Unavailable) | — |
| March 2026–May 2026 | 141 / 5,365 | 2.6% | March 2025–May 2025: Unavailable / Unavailable (Unavailable) | — |
| June 2026–August 2026 | 133 / 4,987 | 2.7% | June 2025–August 2025: 137 / 4,855 (2.8%) | -0.2 pp |
| September 2026 | 44 / 1,777 | 2.5% | September 2025: 32 / 1,560 (2.1%) | +0.4 pp |
Eczema & dermatitisShow 3 topics Hide topics 2.1% 2.8% 2.1%3.3% last year
Other dermatitisView figures and history 1.3% 1.1% 1.3%1.2% last year
Other dermatitis
Other forms of dermatitis discussed or assessed.
23 of 1,777 qualifying appointments addressed this concern.
Trailing 12 months: 226 appointments (1.1%) of 20,033.
Exact monthly figures — all saved history
| Month | Topic appointments | Qualifying appointments | Share |
|---|---|---|---|
| June 2025 | 18 | 1,787 | 1.0% |
| July 2025 | 16 | 1,617 | 1.0% |
| August 2025 | 13 | 1,451 | 0.9% |
| September 2025 | 19 | 1,560 | 1.2% |
| October 2025 | 11 | 1,450 | 0.8% |
| November 2025 | 17 | 1,505 | 1.1% |
| December 2025 | 16 | 1,603 | 1.0% |
| January 2026 | 26 | 1,739 | 1.5% |
| February 2026 | 11 | 1,607 | 0.7% |
| March 2026 | 23 | 1,843 | 1.2% |
| April 2026 | 26 | 1,725 | 1.5% |
| May 2026 | 14 | 1,797 | 0.8% |
| June 2026 | 23 | 1,697 | 1.4% |
| July 2026 | 21 | 1,733 | 1.2% |
| August 2026 | 15 | 1,557 | 1.0% |
| September 2026 | 23 | 1,777 | 1.3% |
Seasonal comparisons — matched periods
| Period | Appointments / qualifying | Share | Last year | Change |
|---|---|---|---|---|
| June 2025–August 2025 | 47 / 4,855 | 1.0% | June 2024–August 2024: Unavailable / Unavailable (Unavailable) | — |
| September 2025–November 2025 | 47 / 4,515 | 1.0% | September 2024–November 2024: Unavailable / Unavailable (Unavailable) | — |
| December 2025–February 2026 | 53 / 4,949 | 1.1% | December 2024–February 2025: Unavailable / Unavailable (Unavailable) | — |
| March 2026–May 2026 | 63 / 5,365 | 1.2% | March 2025–May 2025: Unavailable / Unavailable (Unavailable) | — |
| June 2026–August 2026 | 59 / 4,987 | 1.2% | June 2025–August 2025: 47 / 4,855 (1.0%) | +0.2 pp |
| September 2026 | 23 / 1,777 | 1.3% | September 2025: 19 / 1,560 (1.2%) | +0.1 pp |
EczemaView figures and history 0.5% 1.4% 0.5%1.5% last year
Eczema
Eczema specifically discussed or assessed.
8 of 1,777 qualifying appointments addressed this concern.
Trailing 12 months: 274 appointments (1.4%) of 20,033.
Exact monthly figures — all saved history
| Month | Topic appointments | Qualifying appointments | Share |
|---|---|---|---|
| June 2025 | 25 | 1,787 | 1.4% |
| July 2025 | 15 | 1,617 | 0.9% |
| August 2025 | 16 | 1,451 | 1.1% |
| September 2025 | 24 | 1,560 | 1.5% |
| October 2025 | 15 | 1,450 | 1.0% |
| November 2025 | 20 | 1,505 | 1.3% |
| December 2025 | 30 | 1,603 | 1.9% |
| January 2026 | 17 | 1,739 | 1.0% |
| February 2026 | 28 | 1,607 | 1.7% |
| March 2026 | 33 | 1,843 | 1.8% |
| April 2026 | 24 | 1,725 | 1.4% |
| May 2026 | 33 | 1,797 | 1.8% |
| June 2026 | 24 | 1,697 | 1.4% |
| July 2026 | 18 | 1,733 | 1.0% |
| August 2026 | 24 | 1,557 | 1.5% |
| September 2026 | 8 | 1,777 | 0.5% |
Seasonal comparisons — matched periods
| Period | Appointments / qualifying | Share | Last year | Change |
|---|---|---|---|---|
| June 2025–August 2025 | 56 / 4,855 | 1.2% | June 2024–August 2024: Unavailable / Unavailable (Unavailable) | — |
| September 2025–November 2025 | 59 / 4,515 | 1.3% | September 2024–November 2024: Unavailable / Unavailable (Unavailable) | — |
| December 2025–February 2026 | 75 / 4,949 | 1.5% | December 2024–February 2025: Unavailable / Unavailable (Unavailable) | — |
| March 2026–May 2026 | 90 / 5,365 | 1.7% | March 2025–May 2025: Unavailable / Unavailable (Unavailable) | — |
| June 2026–August 2026 | 66 / 4,987 | 1.3% | June 2025–August 2025: 56 / 4,855 (1.2%) | +0.2 pp |
| September 2026 | 8 / 1,777 | 0.5% | September 2025: 24 / 1,560 (1.5%) | -1.1 pp |
Contact dermatitisView figures and history 0.4% 0.3% 0.4%0.6% last year
Contact dermatitis
Contact dermatitis specifically discussed or assessed.
7 of 1,777 qualifying appointments addressed this concern.
Trailing 12 months: 68 appointments (0.3%) of 20,033.
Exact monthly figures — all saved history
| Month | Topic appointments | Qualifying appointments | Share |
|---|---|---|---|
| June 2025 | 7 | 1,787 | 0.4% |
| July 2025 | 1 | 1,617 | 0.1% |
| August 2025 | 1 | 1,451 | 0.1% |
| September 2025 | 9 | 1,560 | 0.6% |
| October 2025 | 4 | 1,450 | 0.3% |
| November 2025 | 1 | 1,505 | 0.1% |
| December 2025 | 8 | 1,603 | 0.5% |
| January 2026 | 8 | 1,739 | 0.5% |
| February 2026 | 12 | 1,607 | 0.7% |
| March 2026 | 5 | 1,843 | 0.3% |
| April 2026 | 3 | 1,725 | 0.2% |
| May 2026 | 5 | 1,797 | 0.3% |
| June 2026 | 4 | 1,697 | 0.2% |
| July 2026 | 6 | 1,733 | 0.3% |
| August 2026 | 5 | 1,557 | 0.3% |
| September 2026 | 7 | 1,777 | 0.4% |
Seasonal comparisons — matched periods
| Period | Appointments / qualifying | Share | Last year | Change |
|---|---|---|---|---|
| June 2025–August 2025 | 9 / 4,855 | 0.2% | June 2024–August 2024: Unavailable / Unavailable (Unavailable) | — |
| September 2025–November 2025 | 14 / 4,515 | 0.3% | September 2024–November 2024: Unavailable / Unavailable (Unavailable) | — |
| December 2025–February 2026 | 28 / 4,949 | 0.6% | December 2024–February 2025: Unavailable / Unavailable (Unavailable) | — |
| March 2026–May 2026 | 13 / 5,365 | 0.2% | March 2025–May 2025: Unavailable / Unavailable (Unavailable) | — |
| June 2026–August 2026 | 15 / 4,987 | 0.3% | June 2025–August 2025: 9 / 4,855 (0.2%) | +0.1 pp |
| September 2026 | 7 / 1,777 | 0.4% | September 2025: 9 / 1,560 (0.6%) | -0.2 pp |
View trends
Eczema & dermatitis
Eczema, contact dermatitis and other forms of dermatitis.
38 of 1,777 qualifying appointments addressed this concern.
Trailing 12 months: 557 appointments (2.8%) of 20,033.
Exact monthly figures — all saved history
| Month | Topic appointments | Qualifying appointments | Share |
|---|---|---|---|
| June 2025 | 50 | 1,787 | 2.8% |
| July 2025 | 31 | 1,617 | 1.9% |
| August 2025 | 29 | 1,451 | 2.0% |
| September 2025 | 51 | 1,560 | 3.3% |
| October 2025 | 30 | 1,450 | 2.1% |
| November 2025 | 38 | 1,505 | 2.5% |
| December 2025 | 51 | 1,603 | 3.2% |
| January 2026 | 49 | 1,739 | 2.8% |
| February 2026 | 51 | 1,607 | 3.2% |
| March 2026 | 60 | 1,843 | 3.3% |
| April 2026 | 52 | 1,725 | 3.0% |
| May 2026 | 52 | 1,797 | 2.9% |
| June 2026 | 50 | 1,697 | 2.9% |
| July 2026 | 44 | 1,733 | 2.5% |
| August 2026 | 42 | 1,557 | 2.7% |
| September 2026 | 38 | 1,777 | 2.1% |
Seasonal comparisons — matched periods
| Period | Appointments / qualifying | Share | Last year | Change |
|---|---|---|---|---|
| June 2025–August 2025 | 110 / 4,855 | 2.3% | June 2024–August 2024: Unavailable / Unavailable (Unavailable) | — |
| September 2025–November 2025 | 119 / 4,515 | 2.6% | September 2024–November 2024: Unavailable / Unavailable (Unavailable) | — |
| December 2025–February 2026 | 151 / 4,949 | 3.1% | December 2024–February 2025: Unavailable / Unavailable (Unavailable) | — |
| March 2026–May 2026 | 164 / 5,365 | 3.1% | March 2025–May 2025: Unavailable / Unavailable (Unavailable) | — |
| June 2026–August 2026 | 136 / 4,987 | 2.7% | June 2025–August 2025: 110 / 4,855 (2.3%) | +0.5 pp |
| September 2026 | 38 / 1,777 | 2.1% | September 2025: 51 / 1,560 (3.3%) | -1.1 pp |
Bites & stingsView figures and history 1.0% 0.6% 1.0%0.7% last year
Bites & stings
Skin concerns relating to bites or stings, including infected bites.
18 of 1,777 qualifying appointments addressed this concern.
Trailing 12 months: 117 appointments (0.6%) of 20,033.
Exact monthly figures — all saved history
| Month | Topic appointments | Qualifying appointments | Share |
|---|---|---|---|
| June 2025 | 24 | 1,787 | 1.3% |
| July 2025 | 30 | 1,617 | 1.9% |
| August 2025 | 15 | 1,451 | 1.0% |
| September 2025 | 11 | 1,560 | 0.7% |
| October 2025 | 6 | 1,450 | 0.4% |
| November 2025 | 5 | 1,505 | 0.3% |
| December 2025 | 3 | 1,603 | 0.2% |
| January 2026 | 3 | 1,739 | 0.2% |
| February 2026 | 2 | 1,607 | 0.1% |
| March 2026 | 4 | 1,843 | 0.2% |
| April 2026 | 2 | 1,725 | 0.1% |
| May 2026 | 14 | 1,797 | 0.8% |
| June 2026 | 25 | 1,697 | 1.5% |
| July 2026 | 12 | 1,733 | 0.7% |
| August 2026 | 23 | 1,557 | 1.5% |
| September 2026 | 18 | 1,777 | 1.0% |
Seasonal comparisons — matched periods
| Period | Appointments / qualifying | Share | Last year | Change |
|---|---|---|---|---|
| June 2025–August 2025 | 69 / 4,855 | 1.4% | June 2024–August 2024: Unavailable / Unavailable (Unavailable) | — |
| September 2025–November 2025 | 22 / 4,515 | 0.5% | September 2024–November 2024: Unavailable / Unavailable (Unavailable) | — |
| December 2025–February 2026 | 8 / 4,949 | 0.2% | December 2024–February 2025: Unavailable / Unavailable (Unavailable) | — |
| March 2026–May 2026 | 20 / 5,365 | 0.4% | March 2025–May 2025: Unavailable / Unavailable (Unavailable) | — |
| June 2026–August 2026 | 60 / 4,987 | 1.2% | June 2025–August 2025: 69 / 4,855 (1.4%) | -0.2 pp |
| September 2026 | 18 / 1,777 | 1.0% | September 2025: 11 / 1,560 (0.7%) | +0.3 pp |
PsoriasisView figures and history 0.5% 0.3% 0.5%0.1% last year
Psoriasis
Psoriasis assessment, treatment or review.
8 of 1,777 qualifying appointments addressed this concern.
Trailing 12 months: 58 appointments (0.3%) of 20,033.
Exact monthly figures — all saved history
| Month | Topic appointments | Qualifying appointments | Share |
|---|---|---|---|
| June 2025 | 6 | 1,787 | 0.3% |
| July 2025 | 3 | 1,617 | 0.2% |
| August 2025 | 2 | 1,451 | 0.1% |
| September 2025 | 2 | 1,560 | 0.1% |
| October 2025 | 3 | 1,450 | 0.2% |
| November 2025 | 2 | 1,505 | 0.1% |
| December 2025 | 4 | 1,603 | 0.2% |
| January 2026 | 6 | 1,739 | 0.3% |
| February 2026 | 6 | 1,607 | 0.4% |
| March 2026 | 4 | 1,843 | 0.2% |
| April 2026 | 4 | 1,725 | 0.2% |
| May 2026 | 9 | 1,797 | 0.5% |
| June 2026 | 3 | 1,697 | 0.2% |
| July 2026 | 5 | 1,733 | 0.3% |
| August 2026 | 4 | 1,557 | 0.3% |
| September 2026 | 8 | 1,777 | 0.5% |
Seasonal comparisons — matched periods
| Period | Appointments / qualifying | Share | Last year | Change |
|---|---|---|---|---|
| June 2025–August 2025 | 11 / 4,855 | 0.2% | June 2024–August 2024: Unavailable / Unavailable (Unavailable) | — |
| September 2025–November 2025 | 7 / 4,515 | 0.2% | September 2024–November 2024: Unavailable / Unavailable (Unavailable) | — |
| December 2025–February 2026 | 16 / 4,949 | 0.3% | December 2024–February 2025: Unavailable / Unavailable (Unavailable) | — |
| March 2026–May 2026 | 17 / 5,365 | 0.3% | March 2025–May 2025: Unavailable / Unavailable (Unavailable) | — |
| June 2026–August 2026 | 12 / 4,987 | 0.2% | June 2025–August 2025: 11 / 4,855 (0.2%) | 0.0 pp |
| September 2026 | 8 / 1,777 | 0.5% | September 2025: 2 / 1,560 (0.1%) | +0.3 pp |
AcneView figures and history 0.2% 0.6% 0.2%0.4% last year
Acne
Acne assessment, treatment or review.
4 of 1,777 qualifying appointments addressed this concern.
Trailing 12 months: 119 appointments (0.6%) of 20,033.
Exact monthly figures — all saved history
| Month | Topic appointments | Qualifying appointments | Share |
|---|---|---|---|
| June 2025 | 2 | 1,787 | 0.1% |
| July 2025 | 11 | 1,617 | 0.7% |
| August 2025 | 8 | 1,451 | 0.6% |
| September 2025 | 6 | 1,560 | 0.4% |
| October 2025 | 10 | 1,450 | 0.7% |
| November 2025 | 7 | 1,505 | 0.5% |
| December 2025 | 7 | 1,603 | 0.4% |
| January 2026 | 11 | 1,739 | 0.6% |
| February 2026 | 16 | 1,607 | 1.0% |
| March 2026 | 11 | 1,843 | 0.6% |
| April 2026 | 9 | 1,725 | 0.5% |
| May 2026 | 6 | 1,797 | 0.3% |
| June 2026 | 8 | 1,697 | 0.5% |
| July 2026 | 14 | 1,733 | 0.8% |
| August 2026 | 16 | 1,557 | 1.0% |
| September 2026 | 4 | 1,777 | 0.2% |
Seasonal comparisons — matched periods
| Period | Appointments / qualifying | Share | Last year | Change |
|---|---|---|---|---|
| June 2025–August 2025 | 21 / 4,855 | 0.4% | June 2024–August 2024: Unavailable / Unavailable (Unavailable) | — |
| September 2025–November 2025 | 23 / 4,515 | 0.5% | September 2024–November 2024: Unavailable / Unavailable (Unavailable) | — |
| December 2025–February 2026 | 34 / 4,949 | 0.7% | December 2024–February 2025: Unavailable / Unavailable (Unavailable) | — |
| March 2026–May 2026 | 26 / 5,365 | 0.5% | March 2025–May 2025: Unavailable / Unavailable (Unavailable) | — |
| June 2026–August 2026 | 38 / 4,987 | 0.8% | June 2025–August 2025: 21 / 4,855 (0.4%) | +0.3 pp |
| September 2026 | 4 / 1,777 | 0.2% | September 2025: 6 / 1,560 (0.4%) | -0.2 pp |
RosaceaView figures and history 0.2% 0.2% 0.2%0.2% last year
Rosacea
Rosacea assessment, treatment or review.
3 of 1,777 qualifying appointments addressed this concern.
Trailing 12 months: 45 appointments (0.2%) of 20,033.
Exact monthly figures — all saved history
| Month | Topic appointments | Qualifying appointments | Share |
|---|---|---|---|
| June 2025 | 4 | 1,787 | 0.2% |
| July 2025 | 3 | 1,617 | 0.2% |
| August 2025 | 1 | 1,451 | 0.1% |
| September 2025 | 3 | 1,560 | 0.2% |
| October 2025 | 3 | 1,450 | 0.2% |
| November 2025 | 2 | 1,505 | 0.1% |
| December 2025 | 2 | 1,603 | 0.1% |
| January 2026 | 6 | 1,739 | 0.3% |
| February 2026 | 5 | 1,607 | 0.3% |
| March 2026 | 8 | 1,843 | 0.4% |
| April 2026 | 4 | 1,725 | 0.2% |
| May 2026 | 4 | 1,797 | 0.2% |
| June 2026 | 5 | 1,697 | 0.3% |
| July 2026 | 2 | 1,733 | 0.1% |
| August 2026 | 1 | 1,557 | 0.1% |
| September 2026 | 3 | 1,777 | 0.2% |
Seasonal comparisons — matched periods
| Period | Appointments / qualifying | Share | Last year | Change |
|---|---|---|---|---|
| June 2025–August 2025 | 8 / 4,855 | 0.2% | June 2024–August 2024: Unavailable / Unavailable (Unavailable) | — |
| September 2025–November 2025 | 8 / 4,515 | 0.2% | September 2024–November 2024: Unavailable / Unavailable (Unavailable) | — |
| December 2025–February 2026 | 13 / 4,949 | 0.3% | December 2024–February 2025: Unavailable / Unavailable (Unavailable) | — |
| March 2026–May 2026 | 16 / 5,365 | 0.3% | March 2025–May 2025: Unavailable / Unavailable (Unavailable) | — |
| June 2026–August 2026 | 8 / 4,987 | 0.2% | June 2025–August 2025: 8 / 4,855 (0.2%) | 0.0 pp |
| September 2026 | 3 / 1,777 | 0.2% | September 2025: 3 / 1,560 (0.2%) | 0.0 pp |
View trends
Skin
Skin concerns, including rashes, eczema, acne, infections, moles and other lesions.
278 of 1,777 qualifying appointments addressed this concern.
Trailing 12 months: 2,926 appointments (14.6%) of 20,033.
Exact monthly figures — all saved history
| Month | Topic appointments | Qualifying appointments | Share |
|---|---|---|---|
| June 2025 | 303 | 1,787 | 17.0% |
| July 2025 | 275 | 1,617 | 17.0% |
| August 2025 | 242 | 1,451 | 16.7% |
| September 2025 | 245 | 1,560 | 15.7% |
| October 2025 | 197 | 1,450 | 13.6% |
| November 2025 | 188 | 1,505 | 12.5% |
| December 2025 | 209 | 1,603 | 13.0% |
| January 2026 | 218 | 1,739 | 12.5% |
| February 2026 | 236 | 1,607 | 14.7% |
| March 2026 | 293 | 1,843 | 15.9% |
| April 2026 | 246 | 1,725 | 14.3% |
| May 2026 | 262 | 1,797 | 14.6% |
| June 2026 | 271 | 1,697 | 16.0% |
| July 2026 | 275 | 1,733 | 15.9% |
| August 2026 | 253 | 1,557 | 16.2% |
| September 2026 | 278 | 1,777 | 15.6% |
Seasonal comparisons — matched periods
| Period | Appointments / qualifying | Share | Last year | Change |
|---|---|---|---|---|
| June 2025–August 2025 | 820 / 4,855 | 16.9% | June 2024–August 2024: Unavailable / Unavailable (Unavailable) | — |
| September 2025–November 2025 | 630 / 4,515 | 14.0% | September 2024–November 2024: Unavailable / Unavailable (Unavailable) | — |
| December 2025–February 2026 | 663 / 4,949 | 13.4% | December 2024–February 2025: Unavailable / Unavailable (Unavailable) | — |
| March 2026–May 2026 | 801 / 5,365 | 14.9% | March 2025–May 2025: Unavailable / Unavailable (Unavailable) | — |
| June 2026–August 2026 | 799 / 4,987 | 16.0% | June 2025–August 2025: 820 / 4,855 (16.9%) | -0.9 pp |
| September 2026 | 278 / 1,777 | 15.6% | September 2025: 245 / 1,560 (15.7%) | -0.1 pp |
Ear, nose & throatShow 6 topics Hide topics 12.3% 14.1% 12.3%14.6% last year
Sinusitis & other nose concernsShow 2 topics Hide topics 3.7% 3.9% 3.7%3.1% last year
SinusitisView figures and history 1.9% 2.5% 1.9%1.5% last year
Sinusitis
Sinusitis specifically discussed or assessed.
34 of 1,777 qualifying appointments addressed this concern.
Trailing 12 months: 494 appointments (2.5%) of 20,033.
Exact monthly figures — all saved history
| Month | Topic appointments | Qualifying appointments | Share |
|---|---|---|---|
| June 2025 | 55 | 1,787 | 3.1% |
| July 2025 | 31 | 1,617 | 1.9% |
| August 2025 | 28 | 1,451 | 1.9% |
| September 2025 | 24 | 1,560 | 1.5% |
| October 2025 | 46 | 1,450 | 3.2% |
| November 2025 | 42 | 1,505 | 2.8% |
| December 2025 | 55 | 1,603 | 3.4% |
| January 2026 | 48 | 1,739 | 2.8% |
| February 2026 | 42 | 1,607 | 2.6% |
| March 2026 | 39 | 1,843 | 2.1% |
| April 2026 | 49 | 1,725 | 2.8% |
| May 2026 | 45 | 1,797 | 2.5% |
| June 2026 | 38 | 1,697 | 2.2% |
| July 2026 | 28 | 1,733 | 1.6% |
| August 2026 | 28 | 1,557 | 1.8% |
| September 2026 | 34 | 1,777 | 1.9% |
Seasonal comparisons — matched periods
| Period | Appointments / qualifying | Share | Last year | Change |
|---|---|---|---|---|
| June 2025–August 2025 | 114 / 4,855 | 2.3% | June 2024–August 2024: Unavailable / Unavailable (Unavailable) | — |
| September 2025–November 2025 | 112 / 4,515 | 2.5% | September 2024–November 2024: Unavailable / Unavailable (Unavailable) | — |
| December 2025–February 2026 | 145 / 4,949 | 2.9% | December 2024–February 2025: Unavailable / Unavailable (Unavailable) | — |
| March 2026–May 2026 | 133 / 5,365 | 2.5% | March 2025–May 2025: Unavailable / Unavailable (Unavailable) | — |
| June 2026–August 2026 | 94 / 4,987 | 1.9% | June 2025–August 2025: 114 / 4,855 (2.3%) | -0.5 pp |
| September 2026 | 34 / 1,777 | 1.9% | September 2025: 24 / 1,560 (1.5%) | +0.4 pp |
Other nose concernsView figures and history 1.7% 1.5% 1.7%1.5% last year
Other nose concerns
Other nasal symptoms or concerns, such as obstruction or nosebleeds.
31 of 1,777 qualifying appointments addressed this concern.
Trailing 12 months: 296 appointments (1.5%) of 20,033.
Exact monthly figures — all saved history
| Month | Topic appointments | Qualifying appointments | Share |
|---|---|---|---|
| June 2025 | 28 | 1,787 | 1.6% |
| July 2025 | 22 | 1,617 | 1.4% |
| August 2025 | 23 | 1,451 | 1.6% |
| September 2025 | 24 | 1,560 | 1.5% |
| October 2025 | 14 | 1,450 | 1.0% |
| November 2025 | 20 | 1,505 | 1.3% |
| December 2025 | 23 | 1,603 | 1.4% |
| January 2026 | 22 | 1,739 | 1.3% |
| February 2026 | 26 | 1,607 | 1.6% |
| March 2026 | 31 | 1,843 | 1.7% |
| April 2026 | 32 | 1,725 | 1.9% |
| May 2026 | 21 | 1,797 | 1.2% |
| June 2026 | 26 | 1,697 | 1.5% |
| July 2026 | 28 | 1,733 | 1.6% |
| August 2026 | 22 | 1,557 | 1.4% |
| September 2026 | 31 | 1,777 | 1.7% |
Seasonal comparisons — matched periods
| Period | Appointments / qualifying | Share | Last year | Change |
|---|---|---|---|---|
| June 2025–August 2025 | 73 / 4,855 | 1.5% | June 2024–August 2024: Unavailable / Unavailable (Unavailable) | — |
| September 2025–November 2025 | 58 / 4,515 | 1.3% | September 2024–November 2024: Unavailable / Unavailable (Unavailable) | — |
| December 2025–February 2026 | 71 / 4,949 | 1.4% | December 2024–February 2025: Unavailable / Unavailable (Unavailable) | — |
| March 2026–May 2026 | 84 / 5,365 | 1.6% | March 2025–May 2025: Unavailable / Unavailable (Unavailable) | — |
| June 2026–August 2026 | 76 / 4,987 | 1.5% | June 2025–August 2025: 73 / 4,855 (1.5%) | 0.0 pp |
| September 2026 | 31 / 1,777 | 1.7% | September 2025: 24 / 1,560 (1.5%) | +0.2 pp |
View trends
Sinusitis & other nose concerns
Sinusitis and other nasal symptoms or concerns.
65 of 1,777 qualifying appointments addressed this concern.
Trailing 12 months: 781 appointments (3.9%) of 20,033.
Exact monthly figures — all saved history
| Month | Topic appointments | Qualifying appointments | Share |
|---|---|---|---|
| June 2025 | 83 | 1,787 | 4.6% |
| July 2025 | 52 | 1,617 | 3.2% |
| August 2025 | 51 | 1,451 | 3.5% |
| September 2025 | 48 | 1,560 | 3.1% |
| October 2025 | 59 | 1,450 | 4.1% |
| November 2025 | 60 | 1,505 | 4.0% |
| December 2025 | 78 | 1,603 | 4.9% |
| January 2026 | 70 | 1,739 | 4.0% |
| February 2026 | 67 | 1,607 | 4.2% |
| March 2026 | 70 | 1,843 | 3.8% |
| April 2026 | 78 | 1,725 | 4.5% |
| May 2026 | 66 | 1,797 | 3.7% |
| June 2026 | 63 | 1,697 | 3.7% |
| July 2026 | 56 | 1,733 | 3.2% |
| August 2026 | 49 | 1,557 | 3.1% |
| September 2026 | 65 | 1,777 | 3.7% |
Seasonal comparisons — matched periods
| Period | Appointments / qualifying | Share | Last year | Change |
|---|---|---|---|---|
| June 2025–August 2025 | 186 / 4,855 | 3.8% | June 2024–August 2024: Unavailable / Unavailable (Unavailable) | — |
| September 2025–November 2025 | 167 / 4,515 | 3.7% | September 2024–November 2024: Unavailable / Unavailable (Unavailable) | — |
| December 2025–February 2026 | 215 / 4,949 | 4.3% | December 2024–February 2025: Unavailable / Unavailable (Unavailable) | — |
| March 2026–May 2026 | 214 / 5,365 | 4.0% | March 2025–May 2025: Unavailable / Unavailable (Unavailable) | — |
| June 2026–August 2026 | 168 / 4,987 | 3.4% | June 2025–August 2025: 186 / 4,855 (3.8%) | -0.5 pp |
| September 2026 | 65 / 1,777 | 3.7% | September 2025: 48 / 1,560 (3.1%) | +0.6 pp |
Tonsillitis & other throat concernsShow 3 topics Hide topics 3.7% 5.1% 3.7%5.3% last year
TonsillitisView figures and history 2.0% 2.3% 2.0%3.4% last year
Tonsillitis
Tonsillitis specifically discussed or assessed.
35 of 1,777 qualifying appointments addressed this concern.
Trailing 12 months: 461 appointments (2.3%) of 20,033.
Exact monthly figures — all saved history
| Month | Topic appointments | Qualifying appointments | Share |
|---|---|---|---|
| June 2025 | 59 | 1,787 | 3.3% |
| July 2025 | 40 | 1,617 | 2.5% |
| August 2025 | 38 | 1,451 | 2.6% |
| September 2025 | 53 | 1,560 | 3.4% |
| October 2025 | 30 | 1,450 | 2.1% |
| November 2025 | 35 | 1,505 | 2.3% |
| December 2025 | 40 | 1,603 | 2.5% |
| January 2026 | 38 | 1,739 | 2.2% |
| February 2026 | 38 | 1,607 | 2.4% |
| March 2026 | 47 | 1,843 | 2.6% |
| April 2026 | 37 | 1,725 | 2.1% |
| May 2026 | 46 | 1,797 | 2.6% |
| June 2026 | 37 | 1,697 | 2.2% |
| July 2026 | 44 | 1,733 | 2.5% |
| August 2026 | 34 | 1,557 | 2.2% |
| September 2026 | 35 | 1,777 | 2.0% |
Seasonal comparisons — matched periods
| Period | Appointments / qualifying | Share | Last year | Change |
|---|---|---|---|---|
| June 2025–August 2025 | 137 / 4,855 | 2.8% | June 2024–August 2024: Unavailable / Unavailable (Unavailable) | — |
| September 2025–November 2025 | 118 / 4,515 | 2.6% | September 2024–November 2024: Unavailable / Unavailable (Unavailable) | — |
| December 2025–February 2026 | 116 / 4,949 | 2.3% | December 2024–February 2025: Unavailable / Unavailable (Unavailable) | — |
| March 2026–May 2026 | 130 / 5,365 | 2.4% | March 2025–May 2025: Unavailable / Unavailable (Unavailable) | — |
| June 2026–August 2026 | 115 / 4,987 | 2.3% | June 2025–August 2025: 137 / 4,855 (2.8%) | -0.5 pp |
| September 2026 | 35 / 1,777 | 2.0% | September 2025: 53 / 1,560 (3.4%) | -1.4 pp |
Other sore throatView figures and history 1.4% 2.3% 1.4%1.7% last year
Other sore throat
Other sore throat concerns without a more specific recorded cause.
25 of 1,777 qualifying appointments addressed this concern.
Trailing 12 months: 460 appointments (2.3%) of 20,033.
Exact monthly figures — all saved history
| Month | Topic appointments | Qualifying appointments | Share |
|---|---|---|---|
| June 2025 | 57 | 1,787 | 3.2% |
| July 2025 | 37 | 1,617 | 2.3% |
| August 2025 | 28 | 1,451 | 1.9% |
| September 2025 | 27 | 1,560 | 1.7% |
| October 2025 | 32 | 1,450 | 2.2% |
| November 2025 | 34 | 1,505 | 2.3% |
| December 2025 | 35 | 1,603 | 2.2% |
| January 2026 | 43 | 1,739 | 2.5% |
| February 2026 | 32 | 1,607 | 2.0% |
| March 2026 | 51 | 1,843 | 2.8% |
| April 2026 | 43 | 1,725 | 2.5% |
| May 2026 | 42 | 1,797 | 2.3% |
| June 2026 | 39 | 1,697 | 2.3% |
| July 2026 | 43 | 1,733 | 2.5% |
| August 2026 | 41 | 1,557 | 2.6% |
| September 2026 | 25 | 1,777 | 1.4% |
Seasonal comparisons — matched periods
| Period | Appointments / qualifying | Share | Last year | Change |
|---|---|---|---|---|
| June 2025–August 2025 | 122 / 4,855 | 2.5% | June 2024–August 2024: Unavailable / Unavailable (Unavailable) | — |
| September 2025–November 2025 | 93 / 4,515 | 2.1% | September 2024–November 2024: Unavailable / Unavailable (Unavailable) | — |
| December 2025–February 2026 | 110 / 4,949 | 2.2% | December 2024–February 2025: Unavailable / Unavailable (Unavailable) | — |
| March 2026–May 2026 | 136 / 5,365 | 2.5% | March 2025–May 2025: Unavailable / Unavailable (Unavailable) | — |
| June 2026–August 2026 | 123 / 4,987 | 2.5% | June 2025–August 2025: 122 / 4,855 (2.5%) | 0.0 pp |
| September 2026 | 25 / 1,777 | 1.4% | September 2025: 27 / 1,560 (1.7%) | -0.3 pp |
Voice & other throat concernsView figures and history 0.3% 0.5% 0.3%0.1% last year
Voice & other throat concerns
Voice problems and other throat concerns.
5 of 1,777 qualifying appointments addressed this concern.
Trailing 12 months: 99 appointments (0.5%) of 20,033.
Exact monthly figures — all saved history
| Month | Topic appointments | Qualifying appointments | Share |
|---|---|---|---|
| June 2025 | 9 | 1,787 | 0.5% |
| July 2025 | 15 | 1,617 | 0.9% |
| August 2025 | 8 | 1,451 | 0.6% |
| September 2025 | 2 | 1,560 | 0.1% |
| October 2025 | 7 | 1,450 | 0.5% |
| November 2025 | 8 | 1,505 | 0.5% |
| December 2025 | 12 | 1,603 | 0.7% |
| January 2026 | 7 | 1,739 | 0.4% |
| February 2026 | 7 | 1,607 | 0.4% |
| March 2026 | 7 | 1,843 | 0.4% |
| April 2026 | 7 | 1,725 | 0.4% |
| May 2026 | 8 | 1,797 | 0.4% |
| June 2026 | 14 | 1,697 | 0.8% |
| July 2026 | 7 | 1,733 | 0.4% |
| August 2026 | 10 | 1,557 | 0.6% |
| September 2026 | 5 | 1,777 | 0.3% |
Seasonal comparisons — matched periods
| Period | Appointments / qualifying | Share | Last year | Change |
|---|---|---|---|---|
| June 2025–August 2025 | 32 / 4,855 | 0.7% | June 2024–August 2024: Unavailable / Unavailable (Unavailable) | — |
| September 2025–November 2025 | 17 / 4,515 | 0.4% | September 2024–November 2024: Unavailable / Unavailable (Unavailable) | — |
| December 2025–February 2026 | 26 / 4,949 | 0.5% | December 2024–February 2025: Unavailable / Unavailable (Unavailable) | — |
| March 2026–May 2026 | 22 / 5,365 | 0.4% | March 2025–May 2025: Unavailable / Unavailable (Unavailable) | — |
| June 2026–August 2026 | 31 / 4,987 | 0.6% | June 2025–August 2025: 32 / 4,855 (0.7%) | 0.0 pp |
| September 2026 | 5 / 1,777 | 0.3% | September 2025: 2 / 1,560 (0.1%) | +0.2 pp |
View trends
Tonsillitis & other throat concerns
Tonsillitis, other sore throats, voice problems and other throat concerns.
65 of 1,777 qualifying appointments addressed this concern.
Trailing 12 months: 1,014 appointments (5.1%) of 20,033.
Exact monthly figures — all saved history
| Month | Topic appointments | Qualifying appointments | Share |
|---|---|---|---|
| June 2025 | 122 | 1,787 | 6.8% |
| July 2025 | 92 | 1,617 | 5.7% |
| August 2025 | 73 | 1,451 | 5.0% |
| September 2025 | 82 | 1,560 | 5.3% |
| October 2025 | 68 | 1,450 | 4.7% |
| November 2025 | 76 | 1,505 | 5.0% |
| December 2025 | 87 | 1,603 | 5.4% |
| January 2026 | 88 | 1,739 | 5.1% |
| February 2026 | 76 | 1,607 | 4.7% |
| March 2026 | 104 | 1,843 | 5.6% |
| April 2026 | 87 | 1,725 | 5.0% |
| May 2026 | 96 | 1,797 | 5.3% |
| June 2026 | 90 | 1,697 | 5.3% |
| July 2026 | 93 | 1,733 | 5.4% |
| August 2026 | 84 | 1,557 | 5.4% |
| September 2026 | 65 | 1,777 | 3.7% |
Seasonal comparisons — matched periods
| Period | Appointments / qualifying | Share | Last year | Change |
|---|---|---|---|---|
| June 2025–August 2025 | 287 / 4,855 | 5.9% | June 2024–August 2024: Unavailable / Unavailable (Unavailable) | — |
| September 2025–November 2025 | 226 / 4,515 | 5.0% | September 2024–November 2024: Unavailable / Unavailable (Unavailable) | — |
| December 2025–February 2026 | 251 / 4,949 | 5.1% | December 2024–February 2025: Unavailable / Unavailable (Unavailable) | — |
| March 2026–May 2026 | 287 / 5,365 | 5.3% | March 2025–May 2025: Unavailable / Unavailable (Unavailable) | — |
| June 2026–August 2026 | 267 / 4,987 | 5.4% | June 2025–August 2025: 287 / 4,855 (5.9%) | -0.6 pp |
| September 2026 | 65 / 1,777 | 3.7% | September 2025: 82 / 1,560 (5.3%) | -1.6 pp |
Ear infectionsShow 3 topics Hide topics 2.9% 2.9% 2.9%4.1% last year
Outer ear infectionView figures and history 2.4% 1.9% 2.4%2.8% last year
Outer ear infection
An infection of the outer ear or ear canal discussed or assessed.
42 of 1,777 qualifying appointments addressed this concern.
Trailing 12 months: 384 appointments (1.9%) of 20,033.
Exact monthly figures — all saved history
| Month | Topic appointments | Qualifying appointments | Share |
|---|---|---|---|
| June 2025 | 34 | 1,787 | 1.9% |
| July 2025 | 52 | 1,617 | 3.2% |
| August 2025 | 41 | 1,451 | 2.8% |
| September 2025 | 44 | 1,560 | 2.8% |
| October 2025 | 42 | 1,450 | 2.9% |
| November 2025 | 36 | 1,505 | 2.4% |
| December 2025 | 19 | 1,603 | 1.2% |
| January 2026 | 28 | 1,739 | 1.6% |
| February 2026 | 28 | 1,607 | 1.7% |
| March 2026 | 33 | 1,843 | 1.8% |
| April 2026 | 26 | 1,725 | 1.5% |
| May 2026 | 27 | 1,797 | 1.5% |
| June 2026 | 23 | 1,697 | 1.4% |
| July 2026 | 44 | 1,733 | 2.5% |
| August 2026 | 36 | 1,557 | 2.3% |
| September 2026 | 42 | 1,777 | 2.4% |
Seasonal comparisons — matched periods
| Period | Appointments / qualifying | Share | Last year | Change |
|---|---|---|---|---|
| June 2025–August 2025 | 127 / 4,855 | 2.6% | June 2024–August 2024: Unavailable / Unavailable (Unavailable) | — |
| September 2025–November 2025 | 122 / 4,515 | 2.7% | September 2024–November 2024: Unavailable / Unavailable (Unavailable) | — |
| December 2025–February 2026 | 75 / 4,949 | 1.5% | December 2024–February 2025: Unavailable / Unavailable (Unavailable) | — |
| March 2026–May 2026 | 86 / 5,365 | 1.6% | March 2025–May 2025: Unavailable / Unavailable (Unavailable) | — |
| June 2026–August 2026 | 103 / 4,987 | 2.1% | June 2025–August 2025: 127 / 4,855 (2.6%) | -0.6 pp |
| September 2026 | 42 / 1,777 | 2.4% | September 2025: 44 / 1,560 (2.8%) | -0.5 pp |
Middle ear infectionView figures and history 0.5% 0.9% 0.5%1.0% last year
Middle ear infection
An infection of the middle ear discussed or assessed.
8 of 1,777 qualifying appointments addressed this concern.
Trailing 12 months: 178 appointments (0.9%) of 20,033.
Exact monthly figures — all saved history
| Month | Topic appointments | Qualifying appointments | Share |
|---|---|---|---|
| June 2025 | 25 | 1,787 | 1.4% |
| July 2025 | 9 | 1,617 | 0.6% |
| August 2025 | 24 | 1,451 | 1.7% |
| September 2025 | 16 | 1,560 | 1.0% |
| October 2025 | 14 | 1,450 | 1.0% |
| November 2025 | 18 | 1,505 | 1.2% |
| December 2025 | 22 | 1,603 | 1.4% |
| January 2026 | 19 | 1,739 | 1.1% |
| February 2026 | 12 | 1,607 | 0.7% |
| March 2026 | 18 | 1,843 | 1.0% |
| April 2026 | 11 | 1,725 | 0.6% |
| May 2026 | 10 | 1,797 | 0.6% |
| June 2026 | 15 | 1,697 | 0.9% |
| July 2026 | 14 | 1,733 | 0.8% |
| August 2026 | 17 | 1,557 | 1.1% |
| September 2026 | 8 | 1,777 | 0.5% |
Seasonal comparisons — matched periods
| Period | Appointments / qualifying | Share | Last year | Change |
|---|---|---|---|---|
| June 2025–August 2025 | 58 / 4,855 | 1.2% | June 2024–August 2024: Unavailable / Unavailable (Unavailable) | — |
| September 2025–November 2025 | 48 / 4,515 | 1.1% | September 2024–November 2024: Unavailable / Unavailable (Unavailable) | — |
| December 2025–February 2026 | 53 / 4,949 | 1.1% | December 2024–February 2025: Unavailable / Unavailable (Unavailable) | — |
| March 2026–May 2026 | 39 / 5,365 | 0.7% | March 2025–May 2025: Unavailable / Unavailable (Unavailable) | — |
| June 2026–August 2026 | 46 / 4,987 | 0.9% | June 2025–August 2025: 58 / 4,855 (1.2%) | -0.3 pp |
| September 2026 | 8 / 1,777 | 0.5% | September 2025: 16 / 1,560 (1.0%) | -0.6 pp |
Other ear infectionView figures and history 0.1% 0.2% 0.1%0.4% last year
Other ear infection
Other ear infections without a more specific recorded type.
2 of 1,777 qualifying appointments addressed this concern.
Trailing 12 months: 37 appointments (0.2%) of 20,033.
Exact monthly figures — all saved history
| Month | Topic appointments | Qualifying appointments | Share |
|---|---|---|---|
| June 2025 | 7 | 1,787 | 0.4% |
| July 2025 | 4 | 1,617 | 0.2% |
| August 2025 | 2 | 1,451 | 0.1% |
| September 2025 | 6 | 1,560 | 0.4% |
| October 2025 | 4 | 1,450 | 0.3% |
| November 2025 | 5 | 1,505 | 0.3% |
| December 2025 | 8 | 1,603 | 0.5% |
| January 2026 | 3 | 1,739 | 0.2% |
| February 2026 | 0 | 1,607 | 0.0% |
| March 2026 | 6 | 1,843 | 0.3% |
| April 2026 | 1 | 1,725 | 0.1% |
| May 2026 | 0 | 1,797 | 0.0% |
| June 2026 | 5 | 1,697 | 0.3% |
| July 2026 | 0 | 1,733 | 0.0% |
| August 2026 | 3 | 1,557 | 0.2% |
| September 2026 | 2 | 1,777 | 0.1% |
Seasonal comparisons — matched periods
| Period | Appointments / qualifying | Share | Last year | Change |
|---|---|---|---|---|
| June 2025–August 2025 | 13 / 4,855 | 0.3% | June 2024–August 2024: Unavailable / Unavailable (Unavailable) | — |
| September 2025–November 2025 | 15 / 4,515 | 0.3% | September 2024–November 2024: Unavailable / Unavailable (Unavailable) | — |
| December 2025–February 2026 | 11 / 4,949 | 0.2% | December 2024–February 2025: Unavailable / Unavailable (Unavailable) | — |
| March 2026–May 2026 | 7 / 5,365 | 0.1% | March 2025–May 2025: Unavailable / Unavailable (Unavailable) | — |
| June 2026–August 2026 | 8 / 4,987 | 0.2% | June 2025–August 2025: 13 / 4,855 (0.3%) | -0.1 pp |
| September 2026 | 2 / 1,777 | 0.1% | September 2025: 6 / 1,560 (0.4%) | -0.3 pp |
View trends
Ear infections
Infections affecting the outer or middle ear, and other ear infections.
51 of 1,777 qualifying appointments addressed this concern.
Trailing 12 months: 586 appointments (2.9%) of 20,033.
Exact monthly figures — all saved history
| Month | Topic appointments | Qualifying appointments | Share |
|---|---|---|---|
| June 2025 | 65 | 1,787 | 3.6% |
| July 2025 | 64 | 1,617 | 4.0% |
| August 2025 | 66 | 1,451 | 4.5% |
| September 2025 | 64 | 1,560 | 4.1% |
| October 2025 | 57 | 1,450 | 3.9% |
| November 2025 | 58 | 1,505 | 3.9% |
| December 2025 | 48 | 1,603 | 3.0% |
| January 2026 | 48 | 1,739 | 2.8% |
| February 2026 | 40 | 1,607 | 2.5% |
| March 2026 | 55 | 1,843 | 3.0% |
| April 2026 | 38 | 1,725 | 2.2% |
| May 2026 | 37 | 1,797 | 2.1% |
| June 2026 | 42 | 1,697 | 2.5% |
| July 2026 | 57 | 1,733 | 3.3% |
| August 2026 | 55 | 1,557 | 3.5% |
| September 2026 | 51 | 1,777 | 2.9% |
Seasonal comparisons — matched periods
| Period | Appointments / qualifying | Share | Last year | Change |
|---|---|---|---|---|
| June 2025–August 2025 | 195 / 4,855 | 4.0% | June 2024–August 2024: Unavailable / Unavailable (Unavailable) | — |
| September 2025–November 2025 | 179 / 4,515 | 4.0% | September 2024–November 2024: Unavailable / Unavailable (Unavailable) | — |
| December 2025–February 2026 | 136 / 4,949 | 2.7% | December 2024–February 2025: Unavailable / Unavailable (Unavailable) | — |
| March 2026–May 2026 | 130 / 5,365 | 2.4% | March 2025–May 2025: Unavailable / Unavailable (Unavailable) | — |
| June 2026–August 2026 | 154 / 4,987 | 3.1% | June 2025–August 2025: 195 / 4,855 (4.0%) | -0.9 pp |
| September 2026 | 51 / 1,777 | 2.9% | September 2025: 64 / 1,560 (4.1%) | -1.2 pp |
Ear wax & blocked earsView figures and history 1.6% 2.0% 1.6%1.7% last year
Ear wax & blocked ears
Ear wax, a blocked-ear sensation or ear pressure addressed at the appointment.
28 of 1,777 qualifying appointments addressed this concern.
Trailing 12 months: 399 appointments (2.0%) of 20,033.
Exact monthly figures — all saved history
| Month | Topic appointments | Qualifying appointments | Share |
|---|---|---|---|
| June 2025 | 34 | 1,787 | 1.9% |
| July 2025 | 29 | 1,617 | 1.8% |
| August 2025 | 26 | 1,451 | 1.8% |
| September 2025 | 27 | 1,560 | 1.7% |
| October 2025 | 27 | 1,450 | 1.9% |
| November 2025 | 21 | 1,505 | 1.4% |
| December 2025 | 34 | 1,603 | 2.1% |
| January 2026 | 35 | 1,739 | 2.0% |
| February 2026 | 37 | 1,607 | 2.3% |
| March 2026 | 46 | 1,843 | 2.5% |
| April 2026 | 29 | 1,725 | 1.7% |
| May 2026 | 36 | 1,797 | 2.0% |
| June 2026 | 43 | 1,697 | 2.5% |
| July 2026 | 33 | 1,733 | 1.9% |
| August 2026 | 30 | 1,557 | 1.9% |
| September 2026 | 28 | 1,777 | 1.6% |
Seasonal comparisons — matched periods
| Period | Appointments / qualifying | Share | Last year | Change |
|---|---|---|---|---|
| June 2025–August 2025 | 89 / 4,855 | 1.8% | June 2024–August 2024: Unavailable / Unavailable (Unavailable) | — |
| September 2025–November 2025 | 75 / 4,515 | 1.7% | September 2024–November 2024: Unavailable / Unavailable (Unavailable) | — |
| December 2025–February 2026 | 106 / 4,949 | 2.1% | December 2024–February 2025: Unavailable / Unavailable (Unavailable) | — |
| March 2026–May 2026 | 111 / 5,365 | 2.1% | March 2025–May 2025: Unavailable / Unavailable (Unavailable) | — |
| June 2026–August 2026 | 106 / 4,987 | 2.1% | June 2025–August 2025: 89 / 4,855 (1.8%) | +0.3 pp |
| September 2026 | 28 / 1,777 | 1.6% | September 2025: 27 / 1,560 (1.7%) | -0.2 pp |
Other ENT concernsView figures and history 1.0% 0.9% 1.0%1.3% last year
Other ENT concerns
Other specifically assessed ear, nose or throat concerns.
18 of 1,777 qualifying appointments addressed this concern.
Trailing 12 months: 190 appointments (0.9%) of 20,033.
Exact monthly figures — all saved history
| Month | Topic appointments | Qualifying appointments | Share |
|---|---|---|---|
| June 2025 | 16 | 1,787 | 0.9% |
| July 2025 | 22 | 1,617 | 1.4% |
| August 2025 | 13 | 1,451 | 0.9% |
| September 2025 | 21 | 1,560 | 1.3% |
| October 2025 | 18 | 1,450 | 1.2% |
| November 2025 | 18 | 1,505 | 1.2% |
| December 2025 | 13 | 1,603 | 0.8% |
| January 2026 | 12 | 1,739 | 0.7% |
| February 2026 | 9 | 1,607 | 0.6% |
| March 2026 | 19 | 1,843 | 1.0% |
| April 2026 | 15 | 1,725 | 0.9% |
| May 2026 | 18 | 1,797 | 1.0% |
| June 2026 | 18 | 1,697 | 1.1% |
| July 2026 | 16 | 1,733 | 0.9% |
| August 2026 | 16 | 1,557 | 1.0% |
| September 2026 | 18 | 1,777 | 1.0% |
Seasonal comparisons — matched periods
| Period | Appointments / qualifying | Share | Last year | Change |
|---|---|---|---|---|
| June 2025–August 2025 | 51 / 4,855 | 1.1% | June 2024–August 2024: Unavailable / Unavailable (Unavailable) | — |
| September 2025–November 2025 | 57 / 4,515 | 1.3% | September 2024–November 2024: Unavailable / Unavailable (Unavailable) | — |
| December 2025–February 2026 | 34 / 4,949 | 0.7% | December 2024–February 2025: Unavailable / Unavailable (Unavailable) | — |
| March 2026–May 2026 | 52 / 5,365 | 1.0% | March 2025–May 2025: Unavailable / Unavailable (Unavailable) | — |
| June 2026–August 2026 | 50 / 4,987 | 1.0% | June 2025–August 2025: 51 / 4,855 (1.1%) | 0.0 pp |
| September 2026 | 18 / 1,777 | 1.0% | September 2025: 21 / 1,560 (1.3%) | -0.3 pp |
Hearing loss & tinnitusShow 3 topics Hide topics 0.9% 1.0% 0.9%0.9% last year
TinnitusView figures and history 0.7% 0.7% 0.7%0.6% last year
Tinnitus
Tinnitus, such as ringing or other sounds heard in the ears.
13 of 1,777 qualifying appointments addressed this concern.
Trailing 12 months: 145 appointments (0.7%) of 20,033.
Exact monthly figures — all saved history
| Month | Topic appointments | Qualifying appointments | Share |
|---|---|---|---|
| June 2025 | 6 | 1,787 | 0.3% |
| July 2025 | 9 | 1,617 | 0.6% |
| August 2025 | 7 | 1,451 | 0.5% |
| September 2025 | 9 | 1,560 | 0.6% |
| October 2025 | 8 | 1,450 | 0.6% |
| November 2025 | 8 | 1,505 | 0.5% |
| December 2025 | 13 | 1,603 | 0.8% |
| January 2026 | 18 | 1,739 | 1.0% |
| February 2026 | 10 | 1,607 | 0.6% |
| March 2026 | 14 | 1,843 | 0.8% |
| April 2026 | 15 | 1,725 | 0.9% |
| May 2026 | 13 | 1,797 | 0.7% |
| June 2026 | 11 | 1,697 | 0.6% |
| July 2026 | 10 | 1,733 | 0.6% |
| August 2026 | 12 | 1,557 | 0.8% |
| September 2026 | 13 | 1,777 | 0.7% |
Seasonal comparisons — matched periods
| Period | Appointments / qualifying | Share | Last year | Change |
|---|---|---|---|---|
| June 2025–August 2025 | 22 / 4,855 | 0.5% | June 2024–August 2024: Unavailable / Unavailable (Unavailable) | — |
| September 2025–November 2025 | 25 / 4,515 | 0.6% | September 2024–November 2024: Unavailable / Unavailable (Unavailable) | — |
| December 2025–February 2026 | 41 / 4,949 | 0.8% | December 2024–February 2025: Unavailable / Unavailable (Unavailable) | — |
| March 2026–May 2026 | 42 / 5,365 | 0.8% | March 2025–May 2025: Unavailable / Unavailable (Unavailable) | — |
| June 2026–August 2026 | 33 / 4,987 | 0.7% | June 2025–August 2025: 22 / 4,855 (0.5%) | +0.2 pp |
| September 2026 | 13 / 1,777 | 0.7% | September 2025: 9 / 1,560 (0.6%) | +0.2 pp |
Hearing lossView figures and history 0.6% 0.5% 0.6%0.3% last year
Hearing loss
Reduced hearing or hearing loss discussed or assessed.
11 of 1,777 qualifying appointments addressed this concern.
Trailing 12 months: 98 appointments (0.5%) of 20,033.
Exact monthly figures — all saved history
| Month | Topic appointments | Qualifying appointments | Share |
|---|---|---|---|
| June 2025 | 5 | 1,787 | 0.3% |
| July 2025 | 4 | 1,617 | 0.2% |
| August 2025 | 7 | 1,451 | 0.5% |
| September 2025 | 5 | 1,560 | 0.3% |
| October 2025 | 8 | 1,450 | 0.6% |
| November 2025 | 5 | 1,505 | 0.3% |
| December 2025 | 8 | 1,603 | 0.5% |
| January 2026 | 9 | 1,739 | 0.5% |
| February 2026 | 6 | 1,607 | 0.4% |
| March 2026 | 7 | 1,843 | 0.4% |
| April 2026 | 8 | 1,725 | 0.5% |
| May 2026 | 8 | 1,797 | 0.4% |
| June 2026 | 11 | 1,697 | 0.6% |
| July 2026 | 9 | 1,733 | 0.5% |
| August 2026 | 8 | 1,557 | 0.5% |
| September 2026 | 11 | 1,777 | 0.6% |
Seasonal comparisons — matched periods
| Period | Appointments / qualifying | Share | Last year | Change |
|---|---|---|---|---|
| June 2025–August 2025 | 16 / 4,855 | 0.3% | June 2024–August 2024: Unavailable / Unavailable (Unavailable) | — |
| September 2025–November 2025 | 18 / 4,515 | 0.4% | September 2024–November 2024: Unavailable / Unavailable (Unavailable) | — |
| December 2025–February 2026 | 23 / 4,949 | 0.5% | December 2024–February 2025: Unavailable / Unavailable (Unavailable) | — |
| March 2026–May 2026 | 23 / 5,365 | 0.4% | March 2025–May 2025: Unavailable / Unavailable (Unavailable) | — |
| June 2026–August 2026 | 28 / 4,987 | 0.6% | June 2025–August 2025: 16 / 4,855 (0.3%) | +0.2 pp |
| September 2026 | 11 / 1,777 | 0.6% | September 2025: 5 / 1,560 (0.3%) | +0.3 pp |
Other hearing concernsView figures and history 0.1% 0.1% 0.1%0.3% last year
Other hearing concerns
Other hearing concerns without a more specific recorded category.
1 of 1,777 qualifying appointments addressed this concern.
Trailing 12 months: 12 appointments (0.1%) of 20,033.
Exact monthly figures — all saved history
| Month | Topic appointments | Qualifying appointments | Share |
|---|---|---|---|
| June 2025 | 0 | 1,787 | 0.0% |
| July 2025 | 0 | 1,617 | 0.0% |
| August 2025 | 0 | 1,451 | 0.0% |
| September 2025 | 5 | 1,560 | 0.3% |
| October 2025 | 0 | 1,450 | 0.0% |
| November 2025 | 2 | 1,505 | 0.1% |
| December 2025 | 2 | 1,603 | 0.1% |
| January 2026 | 2 | 1,739 | 0.1% |
| February 2026 | 0 | 1,607 | 0.0% |
| March 2026 | 0 | 1,843 | 0.0% |
| April 2026 | 1 | 1,725 | 0.1% |
| May 2026 | 1 | 1,797 | 0.1% |
| June 2026 | 1 | 1,697 | 0.1% |
| July 2026 | 1 | 1,733 | 0.1% |
| August 2026 | 1 | 1,557 | 0.1% |
| September 2026 | 1 | 1,777 | 0.1% |
Seasonal comparisons — matched periods
| Period | Appointments / qualifying | Share | Last year | Change |
|---|---|---|---|---|
| June 2025–August 2025 | 0 / 4,855 | 0.0% | June 2024–August 2024: Unavailable / Unavailable (Unavailable) | — |
| September 2025–November 2025 | 7 / 4,515 | 0.2% | September 2024–November 2024: Unavailable / Unavailable (Unavailable) | — |
| December 2025–February 2026 | 4 / 4,949 | 0.1% | December 2024–February 2025: Unavailable / Unavailable (Unavailable) | — |
| March 2026–May 2026 | 2 / 5,365 | 0.0% | March 2025–May 2025: Unavailable / Unavailable (Unavailable) | — |
| June 2026–August 2026 | 3 / 4,987 | 0.1% | June 2025–August 2025: 0 / 4,855 (0.0%) | +0.1 pp |
| September 2026 | 1 / 1,777 | 0.1% | September 2025: 5 / 1,560 (0.3%) | -0.3 pp |
View trends
Hearing loss & tinnitus
Hearing loss, tinnitus and other hearing concerns.
16 of 1,777 qualifying appointments addressed this concern.
Trailing 12 months: 204 appointments (1.0%) of 20,033.
Exact monthly figures — all saved history
| Month | Topic appointments | Qualifying appointments | Share |
|---|---|---|---|
| June 2025 | 8 | 1,787 | 0.4% |
| July 2025 | 10 | 1,617 | 0.6% |
| August 2025 | 11 | 1,451 | 0.8% |
| September 2025 | 14 | 1,560 | 0.9% |
| October 2025 | 12 | 1,450 | 0.8% |
| November 2025 | 12 | 1,505 | 0.8% |
| December 2025 | 19 | 1,603 | 1.2% |
| January 2026 | 23 | 1,739 | 1.3% |
| February 2026 | 14 | 1,607 | 0.9% |
| March 2026 | 18 | 1,843 | 1.0% |
| April 2026 | 19 | 1,725 | 1.1% |
| May 2026 | 18 | 1,797 | 1.0% |
| June 2026 | 17 | 1,697 | 1.0% |
| July 2026 | 16 | 1,733 | 0.9% |
| August 2026 | 20 | 1,557 | 1.3% |
| September 2026 | 16 | 1,777 | 0.9% |
Seasonal comparisons — matched periods
| Period | Appointments / qualifying | Share | Last year | Change |
|---|---|---|---|---|
| June 2025–August 2025 | 29 / 4,855 | 0.6% | June 2024–August 2024: Unavailable / Unavailable (Unavailable) | — |
| September 2025–November 2025 | 38 / 4,515 | 0.8% | September 2024–November 2024: Unavailable / Unavailable (Unavailable) | — |
| December 2025–February 2026 | 56 / 4,949 | 1.1% | December 2024–February 2025: Unavailable / Unavailable (Unavailable) | — |
| March 2026–May 2026 | 55 / 5,365 | 1.0% | March 2025–May 2025: Unavailable / Unavailable (Unavailable) | — |
| June 2026–August 2026 | 53 / 4,987 | 1.1% | June 2025–August 2025: 29 / 4,855 (0.6%) | +0.5 pp |
| September 2026 | 16 / 1,777 | 0.9% | September 2025: 14 / 1,560 (0.9%) | 0.0 pp |
View trends
Ear, nose & throat
Ear, hearing, nose, sinus, throat and voice concerns.
218 of 1,777 qualifying appointments addressed this concern.
Trailing 12 months: 2,829 appointments (14.1%) of 20,033.
Exact monthly figures — all saved history
| Month | Topic appointments | Qualifying appointments | Share |
|---|---|---|---|
| June 2025 | 291 | 1,787 | 16.3% |
| July 2025 | 241 | 1,617 | 14.9% |
| August 2025 | 212 | 1,451 | 14.6% |
| September 2025 | 227 | 1,560 | 14.6% |
| October 2025 | 220 | 1,450 | 15.2% |
| November 2025 | 214 | 1,505 | 14.2% |
| December 2025 | 245 | 1,603 | 15.3% |
| January 2026 | 249 | 1,739 | 14.3% |
| February 2026 | 211 | 1,607 | 13.1% |
| March 2026 | 275 | 1,843 | 14.9% |
| April 2026 | 235 | 1,725 | 13.6% |
| May 2026 | 247 | 1,797 | 13.7% |
| June 2026 | 241 | 1,697 | 14.2% |
| July 2026 | 246 | 1,733 | 14.2% |
| August 2026 | 228 | 1,557 | 14.6% |
| September 2026 | 218 | 1,777 | 12.3% |
Seasonal comparisons — matched periods
| Period | Appointments / qualifying | Share | Last year | Change |
|---|---|---|---|---|
| June 2025–August 2025 | 744 / 4,855 | 15.3% | June 2024–August 2024: Unavailable / Unavailable (Unavailable) | — |
| September 2025–November 2025 | 661 / 4,515 | 14.6% | September 2024–November 2024: Unavailable / Unavailable (Unavailable) | — |
| December 2025–February 2026 | 705 / 4,949 | 14.2% | December 2024–February 2025: Unavailable / Unavailable (Unavailable) | — |
| March 2026–May 2026 | 757 / 5,365 | 14.1% | March 2025–May 2025: Unavailable / Unavailable (Unavailable) | — |
| June 2026–August 2026 | 715 / 4,987 | 14.3% | June 2025–August 2025: 744 / 4,855 (15.3%) | -1.0 pp |
| September 2026 | 218 / 1,777 | 12.3% | September 2025: 227 / 1,560 (14.6%) | -2.3 pp |
Digestion & gutShow 9 topics Hide topics 12.2% 12.6% 12.2%12.3% last year
Abdominal pain & bloatingView figures and history 3.4% 3.0% 3.4%3.1% last year
Abdominal pain & bloating
Abdominal pain or bloating discussed or assessed.
60 of 1,777 qualifying appointments addressed this concern.
Trailing 12 months: 592 appointments (3.0%) of 20,033.
Exact monthly figures — all saved history
| Month | Topic appointments | Qualifying appointments | Share |
|---|---|---|---|
| June 2025 | 42 | 1,787 | 2.4% |
| July 2025 | 38 | 1,617 | 2.4% |
| August 2025 | 34 | 1,451 | 2.3% |
| September 2025 | 49 | 1,560 | 3.1% |
| October 2025 | 37 | 1,450 | 2.6% |
| November 2025 | 33 | 1,505 | 2.2% |
| December 2025 | 38 | 1,603 | 2.4% |
| January 2026 | 50 | 1,739 | 2.9% |
| February 2026 | 47 | 1,607 | 2.9% |
| March 2026 | 53 | 1,843 | 2.9% |
| April 2026 | 64 | 1,725 | 3.7% |
| May 2026 | 60 | 1,797 | 3.3% |
| June 2026 | 46 | 1,697 | 2.7% |
| July 2026 | 53 | 1,733 | 3.1% |
| August 2026 | 51 | 1,557 | 3.3% |
| September 2026 | 60 | 1,777 | 3.4% |
Seasonal comparisons — matched periods
| Period | Appointments / qualifying | Share | Last year | Change |
|---|---|---|---|---|
| June 2025–August 2025 | 114 / 4,855 | 2.3% | June 2024–August 2024: Unavailable / Unavailable (Unavailable) | — |
| September 2025–November 2025 | 119 / 4,515 | 2.6% | September 2024–November 2024: Unavailable / Unavailable (Unavailable) | — |
| December 2025–February 2026 | 135 / 4,949 | 2.7% | December 2024–February 2025: Unavailable / Unavailable (Unavailable) | — |
| March 2026–May 2026 | 177 / 5,365 | 3.3% | March 2025–May 2025: Unavailable / Unavailable (Unavailable) | — |
| June 2026–August 2026 | 150 / 4,987 | 3.0% | June 2025–August 2025: 114 / 4,855 (2.3%) | +0.7 pp |
| September 2026 | 60 / 1,777 | 3.4% | September 2025: 49 / 1,560 (3.1%) | +0.2 pp |
Reflux & indigestionView figures and history 2.9% 2.7% 2.9%2.9% last year
Reflux & indigestion
Acid reflux, heartburn or indigestion discussed or assessed.
52 of 1,777 qualifying appointments addressed this concern.
Trailing 12 months: 538 appointments (2.7%) of 20,033.
Exact monthly figures — all saved history
| Month | Topic appointments | Qualifying appointments | Share |
|---|---|---|---|
| June 2025 | 30 | 1,787 | 1.7% |
| July 2025 | 51 | 1,617 | 3.2% |
| August 2025 | 53 | 1,451 | 3.7% |
| September 2025 | 46 | 1,560 | 2.9% |
| October 2025 | 36 | 1,450 | 2.5% |
| November 2025 | 45 | 1,505 | 3.0% |
| December 2025 | 45 | 1,603 | 2.8% |
| January 2026 | 53 | 1,739 | 3.0% |
| February 2026 | 46 | 1,607 | 2.9% |
| March 2026 | 54 | 1,843 | 2.9% |
| April 2026 | 53 | 1,725 | 3.1% |
| May 2026 | 43 | 1,797 | 2.4% |
| June 2026 | 36 | 1,697 | 2.1% |
| July 2026 | 42 | 1,733 | 2.4% |
| August 2026 | 33 | 1,557 | 2.1% |
| September 2026 | 52 | 1,777 | 2.9% |
Seasonal comparisons — matched periods
| Period | Appointments / qualifying | Share | Last year | Change |
|---|---|---|---|---|
| June 2025–August 2025 | 134 / 4,855 | 2.8% | June 2024–August 2024: Unavailable / Unavailable (Unavailable) | — |
| September 2025–November 2025 | 127 / 4,515 | 2.8% | September 2024–November 2024: Unavailable / Unavailable (Unavailable) | — |
| December 2025–February 2026 | 144 / 4,949 | 2.9% | December 2024–February 2025: Unavailable / Unavailable (Unavailable) | — |
| March 2026–May 2026 | 150 / 5,365 | 2.8% | March 2025–May 2025: Unavailable / Unavailable (Unavailable) | — |
| June 2026–August 2026 | 111 / 4,987 | 2.2% | June 2025–August 2025: 134 / 4,855 (2.8%) | -0.5 pp |
| September 2026 | 52 / 1,777 | 2.9% | September 2025: 46 / 1,560 (2.9%) | 0.0 pp |
Gastroenteritis, diarrhoea & vomitingShow 2 topics Hide topics 2.5% 3.4% 2.5%2.5% last year
Other diarrhoea/vomitingView figures and history 1.7% 1.7% 1.7%1.3% last year
Other diarrhoea/vomiting
Other diarrhoea or vomiting concerns.
30 of 1,777 qualifying appointments addressed this concern.
Trailing 12 months: 336 appointments (1.7%) of 20,033.
Exact monthly figures — all saved history
| Month | Topic appointments | Qualifying appointments | Share |
|---|---|---|---|
| June 2025 | 19 | 1,787 | 1.1% |
| July 2025 | 13 | 1,617 | 0.8% |
| August 2025 | 16 | 1,451 | 1.1% |
| September 2025 | 20 | 1,560 | 1.3% |
| October 2025 | 11 | 1,450 | 0.8% |
| November 2025 | 15 | 1,505 | 1.0% |
| December 2025 | 19 | 1,603 | 1.2% |
| January 2026 | 29 | 1,739 | 1.7% |
| February 2026 | 29 | 1,607 | 1.8% |
| March 2026 | 27 | 1,843 | 1.5% |
| April 2026 | 27 | 1,725 | 1.6% |
| May 2026 | 54 | 1,797 | 3.0% |
| June 2026 | 34 | 1,697 | 2.0% |
| July 2026 | 39 | 1,733 | 2.3% |
| August 2026 | 22 | 1,557 | 1.4% |
| September 2026 | 30 | 1,777 | 1.7% |
Seasonal comparisons — matched periods
| Period | Appointments / qualifying | Share | Last year | Change |
|---|---|---|---|---|
| June 2025–August 2025 | 48 / 4,855 | 1.0% | June 2024–August 2024: Unavailable / Unavailable (Unavailable) | — |
| September 2025–November 2025 | 46 / 4,515 | 1.0% | September 2024–November 2024: Unavailable / Unavailable (Unavailable) | — |
| December 2025–February 2026 | 77 / 4,949 | 1.6% | December 2024–February 2025: Unavailable / Unavailable (Unavailable) | — |
| March 2026–May 2026 | 108 / 5,365 | 2.0% | March 2025–May 2025: Unavailable / Unavailable (Unavailable) | — |
| June 2026–August 2026 | 95 / 4,987 | 1.9% | June 2025–August 2025: 48 / 4,855 (1.0%) | +0.9 pp |
| September 2026 | 30 / 1,777 | 1.7% | September 2025: 20 / 1,560 (1.3%) | +0.4 pp |
GastroenteritisView figures and history 0.8% 1.8% 0.8%1.2% last year
Gastroenteritis
Gastroenteritis specifically discussed or assessed.
14 of 1,777 qualifying appointments addressed this concern.
Trailing 12 months: 354 appointments (1.8%) of 20,033.
Exact monthly figures — all saved history
| Month | Topic appointments | Qualifying appointments | Share |
|---|---|---|---|
| June 2025 | 40 | 1,787 | 2.2% |
| July 2025 | 31 | 1,617 | 1.9% |
| August 2025 | 35 | 1,451 | 2.4% |
| September 2025 | 19 | 1,560 | 1.2% |
| October 2025 | 18 | 1,450 | 1.2% |
| November 2025 | 35 | 1,505 | 2.3% |
| December 2025 | 30 | 1,603 | 1.9% |
| January 2026 | 38 | 1,739 | 2.2% |
| February 2026 | 22 | 1,607 | 1.4% |
| March 2026 | 26 | 1,843 | 1.4% |
| April 2026 | 40 | 1,725 | 2.3% |
| May 2026 | 60 | 1,797 | 3.3% |
| June 2026 | 23 | 1,697 | 1.4% |
| July 2026 | 24 | 1,733 | 1.4% |
| August 2026 | 24 | 1,557 | 1.5% |
| September 2026 | 14 | 1,777 | 0.8% |
Seasonal comparisons — matched periods
| Period | Appointments / qualifying | Share | Last year | Change |
|---|---|---|---|---|
| June 2025–August 2025 | 106 / 4,855 | 2.2% | June 2024–August 2024: Unavailable / Unavailable (Unavailable) | — |
| September 2025–November 2025 | 72 / 4,515 | 1.6% | September 2024–November 2024: Unavailable / Unavailable (Unavailable) | — |
| December 2025–February 2026 | 90 / 4,949 | 1.8% | December 2024–February 2025: Unavailable / Unavailable (Unavailable) | — |
| March 2026–May 2026 | 126 / 5,365 | 2.3% | March 2025–May 2025: Unavailable / Unavailable (Unavailable) | — |
| June 2026–August 2026 | 71 / 4,987 | 1.4% | June 2025–August 2025: 106 / 4,855 (2.2%) | -0.8 pp |
| September 2026 | 14 / 1,777 | 0.8% | September 2025: 19 / 1,560 (1.2%) | -0.4 pp |
View trends
Gastroenteritis, diarrhoea & vomiting
Gastroenteritis, diarrhoea and vomiting concerns.
44 of 1,777 qualifying appointments addressed this concern.
Trailing 12 months: 690 appointments (3.4%) of 20,033.
Exact monthly figures — all saved history
| Month | Topic appointments | Qualifying appointments | Share |
|---|---|---|---|
| June 2025 | 59 | 1,787 | 3.3% |
| July 2025 | 44 | 1,617 | 2.7% |
| August 2025 | 50 | 1,451 | 3.4% |
| September 2025 | 39 | 1,560 | 2.5% |
| October 2025 | 29 | 1,450 | 2.0% |
| November 2025 | 50 | 1,505 | 3.3% |
| December 2025 | 49 | 1,603 | 3.1% |
| January 2026 | 67 | 1,739 | 3.9% |
| February 2026 | 51 | 1,607 | 3.2% |
| March 2026 | 53 | 1,843 | 2.9% |
| April 2026 | 67 | 1,725 | 3.9% |
| May 2026 | 114 | 1,797 | 6.3% |
| June 2026 | 57 | 1,697 | 3.4% |
| July 2026 | 63 | 1,733 | 3.6% |
| August 2026 | 46 | 1,557 | 3.0% |
| September 2026 | 44 | 1,777 | 2.5% |
Seasonal comparisons — matched periods
| Period | Appointments / qualifying | Share | Last year | Change |
|---|---|---|---|---|
| June 2025–August 2025 | 153 / 4,855 | 3.2% | June 2024–August 2024: Unavailable / Unavailable (Unavailable) | — |
| September 2025–November 2025 | 118 / 4,515 | 2.6% | September 2024–November 2024: Unavailable / Unavailable (Unavailable) | — |
| December 2025–February 2026 | 167 / 4,949 | 3.4% | December 2024–February 2025: Unavailable / Unavailable (Unavailable) | — |
| March 2026–May 2026 | 234 / 5,365 | 4.4% | March 2025–May 2025: Unavailable / Unavailable (Unavailable) | — |
| June 2026–August 2026 | 166 / 4,987 | 3.3% | June 2025–August 2025: 153 / 4,855 (3.2%) | +0.2 pp |
| September 2026 | 44 / 1,777 | 2.5% | September 2025: 39 / 1,560 (2.5%) | 0.0 pp |
Haemorrhoids & other anorectal concernsShow 3 topics Hide topics 2.5% 2.5% 2.5%2.2% last year
Other anorectal concernsView figures and history 1.2% 1.2% 1.2%1.0% last year
Other anorectal concerns
Other anorectal symptoms or concerns, such as rectal bleeding.
22 of 1,777 qualifying appointments addressed this concern.
Trailing 12 months: 234 appointments (1.2%) of 20,033.
Exact monthly figures — all saved history
| Month | Topic appointments | Qualifying appointments | Share |
|---|---|---|---|
| June 2025 | 20 | 1,787 | 1.1% |
| July 2025 | 14 | 1,617 | 0.9% |
| August 2025 | 15 | 1,451 | 1.0% |
| September 2025 | 16 | 1,560 | 1.0% |
| October 2025 | 18 | 1,450 | 1.2% |
| November 2025 | 21 | 1,505 | 1.4% |
| December 2025 | 10 | 1,603 | 0.6% |
| January 2026 | 27 | 1,739 | 1.6% |
| February 2026 | 22 | 1,607 | 1.4% |
| March 2026 | 15 | 1,843 | 0.8% |
| April 2026 | 19 | 1,725 | 1.1% |
| May 2026 | 19 | 1,797 | 1.1% |
| June 2026 | 19 | 1,697 | 1.1% |
| July 2026 | 20 | 1,733 | 1.2% |
| August 2026 | 22 | 1,557 | 1.4% |
| September 2026 | 22 | 1,777 | 1.2% |
Seasonal comparisons — matched periods
| Period | Appointments / qualifying | Share | Last year | Change |
|---|---|---|---|---|
| June 2025–August 2025 | 49 / 4,855 | 1.0% | June 2024–August 2024: Unavailable / Unavailable (Unavailable) | — |
| September 2025–November 2025 | 55 / 4,515 | 1.2% | September 2024–November 2024: Unavailable / Unavailable (Unavailable) | — |
| December 2025–February 2026 | 59 / 4,949 | 1.2% | December 2024–February 2025: Unavailable / Unavailable (Unavailable) | — |
| March 2026–May 2026 | 53 / 5,365 | 1.0% | March 2025–May 2025: Unavailable / Unavailable (Unavailable) | — |
| June 2026–August 2026 | 61 / 4,987 | 1.2% | June 2025–August 2025: 49 / 4,855 (1.0%) | +0.2 pp |
| September 2026 | 22 / 1,777 | 1.2% | September 2025: 16 / 1,560 (1.0%) | +0.2 pp |
HaemorrhoidsView figures and history 1.2% 1.1% 1.2%1.0% last year
Haemorrhoids
Haemorrhoids specifically discussed or assessed.
21 of 1,777 qualifying appointments addressed this concern.
Trailing 12 months: 230 appointments (1.1%) of 20,033.
Exact monthly figures — all saved history
| Month | Topic appointments | Qualifying appointments | Share |
|---|---|---|---|
| June 2025 | 16 | 1,787 | 0.9% |
| July 2025 | 22 | 1,617 | 1.4% |
| August 2025 | 12 | 1,451 | 0.8% |
| September 2025 | 15 | 1,560 | 1.0% |
| October 2025 | 18 | 1,450 | 1.2% |
| November 2025 | 17 | 1,505 | 1.1% |
| December 2025 | 16 | 1,603 | 1.0% |
| January 2026 | 19 | 1,739 | 1.1% |
| February 2026 | 22 | 1,607 | 1.4% |
| March 2026 | 17 | 1,843 | 0.9% |
| April 2026 | 15 | 1,725 | 0.9% |
| May 2026 | 19 | 1,797 | 1.1% |
| June 2026 | 30 | 1,697 | 1.8% |
| July 2026 | 16 | 1,733 | 0.9% |
| August 2026 | 20 | 1,557 | 1.3% |
| September 2026 | 21 | 1,777 | 1.2% |
Seasonal comparisons — matched periods
| Period | Appointments / qualifying | Share | Last year | Change |
|---|---|---|---|---|
| June 2025–August 2025 | 50 / 4,855 | 1.0% | June 2024–August 2024: Unavailable / Unavailable (Unavailable) | — |
| September 2025–November 2025 | 50 / 4,515 | 1.1% | September 2024–November 2024: Unavailable / Unavailable (Unavailable) | — |
| December 2025–February 2026 | 57 / 4,949 | 1.2% | December 2024–February 2025: Unavailable / Unavailable (Unavailable) | — |
| March 2026–May 2026 | 51 / 5,365 | 1.0% | March 2025–May 2025: Unavailable / Unavailable (Unavailable) | — |
| June 2026–August 2026 | 66 / 4,987 | 1.3% | June 2025–August 2025: 50 / 4,855 (1.0%) | +0.3 pp |
| September 2026 | 21 / 1,777 | 1.2% | September 2025: 15 / 1,560 (1.0%) | +0.2 pp |
Anal fissureView figures and history 0.3% 0.4% 0.3%0.3% last year
Anal fissure
Anal fissure specifically discussed or assessed.
5 of 1,777 qualifying appointments addressed this concern.
Trailing 12 months: 73 appointments (0.4%) of 20,033.
Exact monthly figures — all saved history
| Month | Topic appointments | Qualifying appointments | Share |
|---|---|---|---|
| June 2025 | 8 | 1,787 | 0.4% |
| July 2025 | 14 | 1,617 | 0.9% |
| August 2025 | 0 | 1,451 | 0.0% |
| September 2025 | 5 | 1,560 | 0.3% |
| October 2025 | 10 | 1,450 | 0.7% |
| November 2025 | 8 | 1,505 | 0.5% |
| December 2025 | 4 | 1,603 | 0.2% |
| January 2026 | 6 | 1,739 | 0.3% |
| February 2026 | 5 | 1,607 | 0.3% |
| March 2026 | 5 | 1,843 | 0.3% |
| April 2026 | 5 | 1,725 | 0.3% |
| May 2026 | 6 | 1,797 | 0.3% |
| June 2026 | 5 | 1,697 | 0.3% |
| July 2026 | 9 | 1,733 | 0.5% |
| August 2026 | 5 | 1,557 | 0.3% |
| September 2026 | 5 | 1,777 | 0.3% |
Seasonal comparisons — matched periods
| Period | Appointments / qualifying | Share | Last year | Change |
|---|---|---|---|---|
| June 2025–August 2025 | 22 / 4,855 | 0.5% | June 2024–August 2024: Unavailable / Unavailable (Unavailable) | — |
| September 2025–November 2025 | 23 / 4,515 | 0.5% | September 2024–November 2024: Unavailable / Unavailable (Unavailable) | — |
| December 2025–February 2026 | 15 / 4,949 | 0.3% | December 2024–February 2025: Unavailable / Unavailable (Unavailable) | — |
| March 2026–May 2026 | 16 / 5,365 | 0.3% | March 2025–May 2025: Unavailable / Unavailable (Unavailable) | — |
| June 2026–August 2026 | 19 / 4,987 | 0.4% | June 2025–August 2025: 22 / 4,855 (0.5%) | -0.1 pp |
| September 2026 | 5 / 1,777 | 0.3% | September 2025: 5 / 1,560 (0.3%) | 0.0 pp |
View trends
Haemorrhoids & other anorectal concerns
Haemorrhoids, anal fissures and other anorectal symptoms or concerns.
44 of 1,777 qualifying appointments addressed this concern.
Trailing 12 months: 498 appointments (2.5%) of 20,033.
Exact monthly figures — all saved history
| Month | Topic appointments | Qualifying appointments | Share |
|---|---|---|---|
| June 2025 | 42 | 1,787 | 2.4% |
| July 2025 | 46 | 1,617 | 2.8% |
| August 2025 | 27 | 1,451 | 1.9% |
| September 2025 | 34 | 1,560 | 2.2% |
| October 2025 | 41 | 1,450 | 2.8% |
| November 2025 | 42 | 1,505 | 2.8% |
| December 2025 | 29 | 1,603 | 1.8% |
| January 2026 | 45 | 1,739 | 2.6% |
| February 2026 | 49 | 1,607 | 3.0% |
| March 2026 | 35 | 1,843 | 1.9% |
| April 2026 | 38 | 1,725 | 2.2% |
| May 2026 | 42 | 1,797 | 2.3% |
| June 2026 | 50 | 1,697 | 2.9% |
| July 2026 | 40 | 1,733 | 2.3% |
| August 2026 | 43 | 1,557 | 2.8% |
| September 2026 | 44 | 1,777 | 2.5% |
Seasonal comparisons — matched periods
| Period | Appointments / qualifying | Share | Last year | Change |
|---|---|---|---|---|
| June 2025–August 2025 | 115 / 4,855 | 2.4% | June 2024–August 2024: Unavailable / Unavailable (Unavailable) | — |
| September 2025–November 2025 | 117 / 4,515 | 2.6% | September 2024–November 2024: Unavailable / Unavailable (Unavailable) | — |
| December 2025–February 2026 | 123 / 4,949 | 2.5% | December 2024–February 2025: Unavailable / Unavailable (Unavailable) | — |
| March 2026–May 2026 | 115 / 5,365 | 2.1% | March 2025–May 2025: Unavailable / Unavailable (Unavailable) | — |
| June 2026–August 2026 | 133 / 4,987 | 2.7% | June 2025–August 2025: 115 / 4,855 (2.4%) | +0.3 pp |
| September 2026 | 44 / 1,777 | 2.5% | September 2025: 34 / 1,560 (2.2%) | +0.3 pp |
ConstipationView figures and history 1.4% 1.4% 1.4%1.7% last year
Constipation
Constipation discussed or assessed.
25 of 1,777 qualifying appointments addressed this concern.
Trailing 12 months: 280 appointments (1.4%) of 20,033.
Exact monthly figures — all saved history
| Month | Topic appointments | Qualifying appointments | Share |
|---|---|---|---|
| June 2025 | 14 | 1,787 | 0.8% |
| July 2025 | 14 | 1,617 | 0.9% |
| August 2025 | 10 | 1,451 | 0.7% |
| September 2025 | 26 | 1,560 | 1.7% |
| October 2025 | 30 | 1,450 | 2.1% |
| November 2025 | 26 | 1,505 | 1.7% |
| December 2025 | 19 | 1,603 | 1.2% |
| January 2026 | 28 | 1,739 | 1.6% |
| February 2026 | 22 | 1,607 | 1.4% |
| March 2026 | 19 | 1,843 | 1.0% |
| April 2026 | 20 | 1,725 | 1.2% |
| May 2026 | 17 | 1,797 | 0.9% |
| June 2026 | 21 | 1,697 | 1.2% |
| July 2026 | 24 | 1,733 | 1.4% |
| August 2026 | 29 | 1,557 | 1.9% |
| September 2026 | 25 | 1,777 | 1.4% |
Seasonal comparisons — matched periods
| Period | Appointments / qualifying | Share | Last year | Change |
|---|---|---|---|---|
| June 2025–August 2025 | 38 / 4,855 | 0.8% | June 2024–August 2024: Unavailable / Unavailable (Unavailable) | — |
| September 2025–November 2025 | 82 / 4,515 | 1.8% | September 2024–November 2024: Unavailable / Unavailable (Unavailable) | — |
| December 2025–February 2026 | 69 / 4,949 | 1.4% | December 2024–February 2025: Unavailable / Unavailable (Unavailable) | — |
| March 2026–May 2026 | 56 / 5,365 | 1.0% | March 2025–May 2025: Unavailable / Unavailable (Unavailable) | — |
| June 2026–August 2026 | 74 / 4,987 | 1.5% | June 2025–August 2025: 38 / 4,855 (0.8%) | +0.7 pp |
| September 2026 | 25 / 1,777 | 1.4% | September 2025: 26 / 1,560 (1.7%) | -0.3 pp |
Other digestive concernsView figures and history 1.1% 1.2% 1.1%1.3% last year
Other digestive concerns
Other digestive symptoms or conditions.
20 of 1,777 qualifying appointments addressed this concern.
Trailing 12 months: 239 appointments (1.2%) of 20,033.
Exact monthly figures — all saved history
| Month | Topic appointments | Qualifying appointments | Share |
|---|---|---|---|
| June 2025 | 17 | 1,787 | 1.0% |
| July 2025 | 24 | 1,617 | 1.5% |
| August 2025 | 17 | 1,451 | 1.2% |
| September 2025 | 20 | 1,560 | 1.3% |
| October 2025 | 18 | 1,450 | 1.2% |
| November 2025 | 9 | 1,505 | 0.6% |
| December 2025 | 12 | 1,603 | 0.7% |
| January 2026 | 26 | 1,739 | 1.5% |
| February 2026 | 26 | 1,607 | 1.6% |
| March 2026 | 21 | 1,843 | 1.1% |
| April 2026 | 22 | 1,725 | 1.3% |
| May 2026 | 30 | 1,797 | 1.7% |
| June 2026 | 21 | 1,697 | 1.2% |
| July 2026 | 15 | 1,733 | 0.9% |
| August 2026 | 19 | 1,557 | 1.2% |
| September 2026 | 20 | 1,777 | 1.1% |
Seasonal comparisons — matched periods
| Period | Appointments / qualifying | Share | Last year | Change |
|---|---|---|---|---|
| June 2025–August 2025 | 58 / 4,855 | 1.2% | June 2024–August 2024: Unavailable / Unavailable (Unavailable) | — |
| September 2025–November 2025 | 47 / 4,515 | 1.0% | September 2024–November 2024: Unavailable / Unavailable (Unavailable) | — |
| December 2025–February 2026 | 64 / 4,949 | 1.3% | December 2024–February 2025: Unavailable / Unavailable (Unavailable) | — |
| March 2026–May 2026 | 73 / 5,365 | 1.4% | March 2025–May 2025: Unavailable / Unavailable (Unavailable) | — |
| June 2026–August 2026 | 55 / 4,987 | 1.1% | June 2025–August 2025: 58 / 4,855 (1.2%) | -0.1 pp |
| September 2026 | 20 / 1,777 | 1.1% | September 2025: 20 / 1,560 (1.3%) | -0.2 pp |
HerniasView figures and history 0.6% 0.6% 0.6%0.6% last year
Hernias
Hernia concerns assessed or reviewed.
11 of 1,777 qualifying appointments addressed this concern.
Trailing 12 months: 118 appointments (0.6%) of 20,033.
Exact monthly figures — all saved history
| Month | Topic appointments | Qualifying appointments | Share |
|---|---|---|---|
| June 2025 | 6 | 1,787 | 0.3% |
| July 2025 | 6 | 1,617 | 0.4% |
| August 2025 | 6 | 1,451 | 0.4% |
| September 2025 | 10 | 1,560 | 0.6% |
| October 2025 | 7 | 1,450 | 0.5% |
| November 2025 | 8 | 1,505 | 0.5% |
| December 2025 | 9 | 1,603 | 0.6% |
| January 2026 | 12 | 1,739 | 0.7% |
| February 2026 | 12 | 1,607 | 0.7% |
| March 2026 | 7 | 1,843 | 0.4% |
| April 2026 | 9 | 1,725 | 0.5% |
| May 2026 | 8 | 1,797 | 0.4% |
| June 2026 | 18 | 1,697 | 1.1% |
| July 2026 | 10 | 1,733 | 0.6% |
| August 2026 | 7 | 1,557 | 0.4% |
| September 2026 | 11 | 1,777 | 0.6% |
Seasonal comparisons — matched periods
| Period | Appointments / qualifying | Share | Last year | Change |
|---|---|---|---|---|
| June 2025–August 2025 | 18 / 4,855 | 0.4% | June 2024–August 2024: Unavailable / Unavailable (Unavailable) | — |
| September 2025–November 2025 | 25 / 4,515 | 0.6% | September 2024–November 2024: Unavailable / Unavailable (Unavailable) | — |
| December 2025–February 2026 | 33 / 4,949 | 0.7% | December 2024–February 2025: Unavailable / Unavailable (Unavailable) | — |
| March 2026–May 2026 | 24 / 5,365 | 0.4% | March 2025–May 2025: Unavailable / Unavailable (Unavailable) | — |
| June 2026–August 2026 | 35 / 4,987 | 0.7% | June 2025–August 2025: 18 / 4,855 (0.4%) | +0.3 pp |
| September 2026 | 11 / 1,777 | 0.6% | September 2025: 10 / 1,560 (0.6%) | 0.0 pp |
IBSView figures and history 0.4% 0.4% 0.4%0.5% last year
IBS
Irritable bowel syndrome (IBS) specifically discussed or assessed.
7 of 1,777 qualifying appointments addressed this concern.
Trailing 12 months: 79 appointments (0.4%) of 20,033.
Exact monthly figures — all saved history
| Month | Topic appointments | Qualifying appointments | Share |
|---|---|---|---|
| June 2025 | 5 | 1,787 | 0.3% |
| July 2025 | 10 | 1,617 | 0.6% |
| August 2025 | 6 | 1,451 | 0.4% |
| September 2025 | 8 | 1,560 | 0.5% |
| October 2025 | 6 | 1,450 | 0.4% |
| November 2025 | 5 | 1,505 | 0.3% |
| December 2025 | 1 | 1,603 | 0.1% |
| January 2026 | 10 | 1,739 | 0.6% |
| February 2026 | 7 | 1,607 | 0.4% |
| March 2026 | 8 | 1,843 | 0.4% |
| April 2026 | 3 | 1,725 | 0.2% |
| May 2026 | 12 | 1,797 | 0.7% |
| June 2026 | 6 | 1,697 | 0.4% |
| July 2026 | 8 | 1,733 | 0.5% |
| August 2026 | 6 | 1,557 | 0.4% |
| September 2026 | 7 | 1,777 | 0.4% |
Seasonal comparisons — matched periods
| Period | Appointments / qualifying | Share | Last year | Change |
|---|---|---|---|---|
| June 2025–August 2025 | 21 / 4,855 | 0.4% | June 2024–August 2024: Unavailable / Unavailable (Unavailable) | — |
| September 2025–November 2025 | 19 / 4,515 | 0.4% | September 2024–November 2024: Unavailable / Unavailable (Unavailable) | — |
| December 2025–February 2026 | 18 / 4,949 | 0.4% | December 2024–February 2025: Unavailable / Unavailable (Unavailable) | — |
| March 2026–May 2026 | 23 / 5,365 | 0.4% | March 2025–May 2025: Unavailable / Unavailable (Unavailable) | — |
| June 2026–August 2026 | 20 / 4,987 | 0.4% | June 2025–August 2025: 21 / 4,855 (0.4%) | 0.0 pp |
| September 2026 | 7 / 1,777 | 0.4% | September 2025: 8 / 1,560 (0.5%) | -0.1 pp |
Inflammatory bowel diseaseShow 3 topics Hide topics 0.1% 0.1% 0.1%0.2% last year
Crohn's diseaseView figures and history 0.1% 0.0% 0.1%0.1% last year
Crohn's disease
Crohn's disease specifically discussed or assessed.
1 of 1,777 qualifying appointments addressed this concern.
Trailing 12 months: 4 appointments (0.0%) of 20,033.
Exact monthly figures — all saved history
| Month | Topic appointments | Qualifying appointments | Share |
|---|---|---|---|
| June 2025 | 1 | 1,787 | 0.1% |
| July 2025 | 1 | 1,617 | 0.1% |
| August 2025 | 1 | 1,451 | 0.1% |
| September 2025 | 2 | 1,560 | 0.1% |
| October 2025 | 0 | 1,450 | 0.0% |
| November 2025 | 0 | 1,505 | 0.0% |
| December 2025 | 1 | 1,603 | 0.1% |
| January 2026 | 0 | 1,739 | 0.0% |
| February 2026 | 0 | 1,607 | 0.0% |
| March 2026 | 0 | 1,843 | 0.0% |
| April 2026 | 0 | 1,725 | 0.0% |
| May 2026 | 0 | 1,797 | 0.0% |
| June 2026 | 0 | 1,697 | 0.0% |
| July 2026 | 1 | 1,733 | 0.1% |
| August 2026 | 1 | 1,557 | 0.1% |
| September 2026 | 1 | 1,777 | 0.1% |
Seasonal comparisons — matched periods
| Period | Appointments / qualifying | Share | Last year | Change |
|---|---|---|---|---|
| June 2025–August 2025 | 3 / 4,855 | 0.1% | June 2024–August 2024: Unavailable / Unavailable (Unavailable) | — |
| September 2025–November 2025 | 2 / 4,515 | 0.0% | September 2024–November 2024: Unavailable / Unavailable (Unavailable) | — |
| December 2025–February 2026 | 1 / 4,949 | 0.0% | December 2024–February 2025: Unavailable / Unavailable (Unavailable) | — |
| March 2026–May 2026 | 0 / 5,365 | 0.0% | March 2025–May 2025: Unavailable / Unavailable (Unavailable) | — |
| June 2026–August 2026 | 2 / 4,987 | 0.0% | June 2025–August 2025: 3 / 4,855 (0.1%) | 0.0 pp |
| September 2026 | 1 / 1,777 | 0.1% | September 2025: 2 / 1,560 (0.1%) | -0.1 pp |
Other/unspecified IBDView figures and history 0.1% 0.0% 0.1%0.1% last year
Other/unspecified IBD
Other or unspecified inflammatory bowel disease (IBD) concerns.
1 of 1,777 qualifying appointments addressed this concern.
Trailing 12 months: 4 appointments (0.0%) of 20,033.
Exact monthly figures — all saved history
| Month | Topic appointments | Qualifying appointments | Share |
|---|---|---|---|
| June 2025 | 0 | 1,787 | 0.0% |
| July 2025 | 0 | 1,617 | 0.0% |
| August 2025 | 0 | 1,451 | 0.0% |
| September 2025 | 1 | 1,560 | 0.1% |
| October 2025 | 0 | 1,450 | 0.0% |
| November 2025 | 0 | 1,505 | 0.0% |
| December 2025 | 0 | 1,603 | 0.0% |
| January 2026 | 0 | 1,739 | 0.0% |
| February 2026 | 0 | 1,607 | 0.0% |
| March 2026 | 1 | 1,843 | 0.1% |
| April 2026 | 0 | 1,725 | 0.0% |
| May 2026 | 0 | 1,797 | 0.0% |
| June 2026 | 1 | 1,697 | 0.1% |
| July 2026 | 0 | 1,733 | 0.0% |
| August 2026 | 1 | 1,557 | 0.1% |
| September 2026 | 1 | 1,777 | 0.1% |
Seasonal comparisons — matched periods
| Period | Appointments / qualifying | Share | Last year | Change |
|---|---|---|---|---|
| June 2025–August 2025 | 0 / 4,855 | 0.0% | June 2024–August 2024: Unavailable / Unavailable (Unavailable) | — |
| September 2025–November 2025 | 1 / 4,515 | 0.0% | September 2024–November 2024: Unavailable / Unavailable (Unavailable) | — |
| December 2025–February 2026 | 0 / 4,949 | 0.0% | December 2024–February 2025: Unavailable / Unavailable (Unavailable) | — |
| March 2026–May 2026 | 1 / 5,365 | 0.0% | March 2025–May 2025: Unavailable / Unavailable (Unavailable) | — |
| June 2026–August 2026 | 2 / 4,987 | 0.0% | June 2025–August 2025: 0 / 4,855 (0.0%) | 0.0 pp |
| September 2026 | 1 / 1,777 | 0.1% | September 2025: 1 / 1,560 (0.1%) | 0.0 pp |
Ulcerative colitisView figures and history 0.0% 0.0% 0.0%0.0% last year
Ulcerative colitis
Ulcerative colitis specifically discussed or assessed.
0 of 1,777 qualifying appointments addressed this concern.
Trailing 12 months: 7 appointments (0.0%) of 20,033.
Exact monthly figures — all saved history
| Month | Topic appointments | Qualifying appointments | Share |
|---|---|---|---|
| June 2025 | 1 | 1,787 | 0.1% |
| July 2025 | 0 | 1,617 | 0.0% |
| August 2025 | 0 | 1,451 | 0.0% |
| September 2025 | 0 | 1,560 | 0.0% |
| October 2025 | 1 | 1,450 | 0.1% |
| November 2025 | 0 | 1,505 | 0.0% |
| December 2025 | 0 | 1,603 | 0.0% |
| January 2026 | 0 | 1,739 | 0.0% |
| February 2026 | 1 | 1,607 | 0.1% |
| March 2026 | 1 | 1,843 | 0.1% |
| April 2026 | 0 | 1,725 | 0.0% |
| May 2026 | 0 | 1,797 | 0.0% |
| June 2026 | 1 | 1,697 | 0.1% |
| July 2026 | 3 | 1,733 | 0.2% |
| August 2026 | 0 | 1,557 | 0.0% |
| September 2026 | 0 | 1,777 | 0.0% |
Seasonal comparisons — matched periods
| Period | Appointments / qualifying | Share | Last year | Change |
|---|---|---|---|---|
| June 2025–August 2025 | 1 / 4,855 | 0.0% | June 2024–August 2024: Unavailable / Unavailable (Unavailable) | — |
| September 2025–November 2025 | 1 / 4,515 | 0.0% | September 2024–November 2024: Unavailable / Unavailable (Unavailable) | — |
| December 2025–February 2026 | 1 / 4,949 | 0.0% | December 2024–February 2025: Unavailable / Unavailable (Unavailable) | — |
| March 2026–May 2026 | 1 / 5,365 | 0.0% | March 2025–May 2025: Unavailable / Unavailable (Unavailable) | — |
| June 2026–August 2026 | 4 / 4,987 | 0.1% | June 2025–August 2025: 1 / 4,855 (0.0%) | +0.1 pp |
| September 2026 | 0 / 1,777 | 0.0% | September 2025: 0 / 1,560 (0.0%) | 0.0 pp |
View trends
Inflammatory bowel disease
Crohn's disease, ulcerative colitis and other inflammatory bowel disease concerns.
2 of 1,777 qualifying appointments addressed this concern.
Trailing 12 months: 15 appointments (0.1%) of 20,033.
Exact monthly figures — all saved history
| Month | Topic appointments | Qualifying appointments | Share |
|---|---|---|---|
| June 2025 | 2 | 1,787 | 0.1% |
| July 2025 | 1 | 1,617 | 0.1% |
| August 2025 | 1 | 1,451 | 0.1% |
| September 2025 | 3 | 1,560 | 0.2% |
| October 2025 | 1 | 1,450 | 0.1% |
| November 2025 | 0 | 1,505 | 0.0% |
| December 2025 | 1 | 1,603 | 0.1% |
| January 2026 | 0 | 1,739 | 0.0% |
| February 2026 | 1 | 1,607 | 0.1% |
| March 2026 | 2 | 1,843 | 0.1% |
| April 2026 | 0 | 1,725 | 0.0% |
| May 2026 | 0 | 1,797 | 0.0% |
| June 2026 | 2 | 1,697 | 0.1% |
| July 2026 | 4 | 1,733 | 0.2% |
| August 2026 | 2 | 1,557 | 0.1% |
| September 2026 | 2 | 1,777 | 0.1% |
Seasonal comparisons — matched periods
| Period | Appointments / qualifying | Share | Last year | Change |
|---|---|---|---|---|
| June 2025–August 2025 | 4 / 4,855 | 0.1% | June 2024–August 2024: Unavailable / Unavailable (Unavailable) | — |
| September 2025–November 2025 | 4 / 4,515 | 0.1% | September 2024–November 2024: Unavailable / Unavailable (Unavailable) | — |
| December 2025–February 2026 | 2 / 4,949 | 0.0% | December 2024–February 2025: Unavailable / Unavailable (Unavailable) | — |
| March 2026–May 2026 | 2 / 5,365 | 0.0% | March 2025–May 2025: Unavailable / Unavailable (Unavailable) | — |
| June 2026–August 2026 | 8 / 4,987 | 0.2% | June 2025–August 2025: 4 / 4,855 (0.1%) | +0.1 pp |
| September 2026 | 2 / 1,777 | 0.1% | September 2025: 3 / 1,560 (0.2%) | -0.1 pp |
View trends
Digestion & gut
Digestive symptoms and conditions, including bowel and anorectal concerns.
216 of 1,777 qualifying appointments addressed this concern.
Trailing 12 months: 2,523 appointments (12.6%) of 20,033.
Exact monthly figures — all saved history
| Month | Topic appointments | Qualifying appointments | Share |
|---|---|---|---|
| June 2025 | 193 | 1,787 | 10.8% |
| July 2025 | 203 | 1,617 | 12.6% |
| August 2025 | 165 | 1,451 | 11.4% |
| September 2025 | 192 | 1,560 | 12.3% |
| October 2025 | 166 | 1,450 | 11.4% |
| November 2025 | 180 | 1,505 | 12.0% |
| December 2025 | 176 | 1,603 | 11.0% |
| January 2026 | 243 | 1,739 | 14.0% |
| February 2026 | 201 | 1,607 | 12.5% |
| March 2026 | 210 | 1,843 | 11.4% |
| April 2026 | 235 | 1,725 | 13.6% |
| May 2026 | 269 | 1,797 | 15.0% |
| June 2026 | 213 | 1,697 | 12.6% |
| July 2026 | 217 | 1,733 | 12.5% |
| August 2026 | 197 | 1,557 | 12.7% |
| September 2026 | 216 | 1,777 | 12.2% |
Seasonal comparisons — matched periods
| Period | Appointments / qualifying | Share | Last year | Change |
|---|---|---|---|---|
| June 2025–August 2025 | 561 / 4,855 | 11.6% | June 2024–August 2024: Unavailable / Unavailable (Unavailable) | — |
| September 2025–November 2025 | 538 / 4,515 | 11.9% | September 2024–November 2024: Unavailable / Unavailable (Unavailable) | — |
| December 2025–February 2026 | 620 / 4,949 | 12.5% | December 2024–February 2025: Unavailable / Unavailable (Unavailable) | — |
| March 2026–May 2026 | 714 / 5,365 | 13.3% | March 2025–May 2025: Unavailable / Unavailable (Unavailable) | — |
| June 2026–August 2026 | 627 / 4,987 | 12.6% | June 2025–August 2025: 561 / 4,855 (11.6%) | +1.0 pp |
| September 2026 | 216 / 1,777 | 12.2% | September 2025: 192 / 1,560 (12.3%) | -0.2 pp |
Muscles, bones & jointsShow 7 topics Hide topics 12.1% 11.9% 12.1%12.1% last year
Injuries & soft-tissue concernsView figures and history 3.5% 3.9% 3.5%3.7% last year
Injuries & soft-tissue concerns
Injuries or soft-tissue concerns, such as sprains and strains.
63 of 1,777 qualifying appointments addressed this concern.
Trailing 12 months: 775 appointments (3.9%) of 20,033.
Exact monthly figures — all saved history
| Month | Topic appointments | Qualifying appointments | Share |
|---|---|---|---|
| June 2025 | 68 | 1,787 | 3.8% |
| July 2025 | 56 | 1,617 | 3.5% |
| August 2025 | 60 | 1,451 | 4.1% |
| September 2025 | 57 | 1,560 | 3.7% |
| October 2025 | 35 | 1,450 | 2.4% |
| November 2025 | 52 | 1,505 | 3.5% |
| December 2025 | 66 | 1,603 | 4.1% |
| January 2026 | 87 | 1,739 | 5.0% |
| February 2026 | 59 | 1,607 | 3.7% |
| March 2026 | 83 | 1,843 | 4.5% |
| April 2026 | 75 | 1,725 | 4.3% |
| May 2026 | 67 | 1,797 | 3.7% |
| June 2026 | 73 | 1,697 | 4.3% |
| July 2026 | 67 | 1,733 | 3.9% |
| August 2026 | 48 | 1,557 | 3.1% |
| September 2026 | 63 | 1,777 | 3.5% |
Seasonal comparisons — matched periods
| Period | Appointments / qualifying | Share | Last year | Change |
|---|---|---|---|---|
| June 2025–August 2025 | 184 / 4,855 | 3.8% | June 2024–August 2024: Unavailable / Unavailable (Unavailable) | — |
| September 2025–November 2025 | 144 / 4,515 | 3.2% | September 2024–November 2024: Unavailable / Unavailable (Unavailable) | — |
| December 2025–February 2026 | 212 / 4,949 | 4.3% | December 2024–February 2025: Unavailable / Unavailable (Unavailable) | — |
| March 2026–May 2026 | 225 / 5,365 | 4.2% | March 2025–May 2025: Unavailable / Unavailable (Unavailable) | — |
| June 2026–August 2026 | 188 / 4,987 | 3.8% | June 2025–August 2025: 184 / 4,855 (3.8%) | 0.0 pp |
| September 2026 | 63 / 1,777 | 3.5% | September 2025: 57 / 1,560 (3.7%) | -0.1 pp |
Joint & limb painView figures and history 2.9% 2.8% 2.9%2.4% last year
Joint & limb pain
Joint or limb pain discussed or assessed.
52 of 1,777 qualifying appointments addressed this concern.
Trailing 12 months: 553 appointments (2.8%) of 20,033.
Exact monthly figures — all saved history
| Month | Topic appointments | Qualifying appointments | Share |
|---|---|---|---|
| June 2025 | 40 | 1,787 | 2.2% |
| July 2025 | 41 | 1,617 | 2.5% |
| August 2025 | 32 | 1,451 | 2.2% |
| September 2025 | 37 | 1,560 | 2.4% |
| October 2025 | 42 | 1,450 | 2.9% |
| November 2025 | 29 | 1,505 | 1.9% |
| December 2025 | 29 | 1,603 | 1.8% |
| January 2026 | 63 | 1,739 | 3.6% |
| February 2026 | 51 | 1,607 | 3.2% |
| March 2026 | 64 | 1,843 | 3.5% |
| April 2026 | 61 | 1,725 | 3.5% |
| May 2026 | 45 | 1,797 | 2.5% |
| June 2026 | 35 | 1,697 | 2.1% |
| July 2026 | 44 | 1,733 | 2.5% |
| August 2026 | 38 | 1,557 | 2.4% |
| September 2026 | 52 | 1,777 | 2.9% |
Seasonal comparisons — matched periods
| Period | Appointments / qualifying | Share | Last year | Change |
|---|---|---|---|---|
| June 2025–August 2025 | 113 / 4,855 | 2.3% | June 2024–August 2024: Unavailable / Unavailable (Unavailable) | — |
| September 2025–November 2025 | 108 / 4,515 | 2.4% | September 2024–November 2024: Unavailable / Unavailable (Unavailable) | — |
| December 2025–February 2026 | 143 / 4,949 | 2.9% | December 2024–February 2025: Unavailable / Unavailable (Unavailable) | — |
| March 2026–May 2026 | 170 / 5,365 | 3.2% | March 2025–May 2025: Unavailable / Unavailable (Unavailable) | — |
| June 2026–August 2026 | 117 / 4,987 | 2.3% | June 2025–August 2025: 113 / 4,855 (2.3%) | 0.0 pp |
| September 2026 | 52 / 1,777 | 2.9% | September 2025: 37 / 1,560 (2.4%) | +0.6 pp |
Back pain & sciaticaShow 2 topics Hide topics 2.4% 2.6% 2.4%2.4% last year
Back pain without specified sciaticaView figures and history 1.7% 2.1% 1.7%2.4% last year
Back pain without specified sciatica
Back pain assessed without specifically recorded sciatica.
30 of 1,777 qualifying appointments addressed this concern.
Trailing 12 months: 411 appointments (2.1%) of 20,033.
Exact monthly figures — all saved history
| Month | Topic appointments | Qualifying appointments | Share |
|---|---|---|---|
| June 2025 | 27 | 1,787 | 1.5% |
| July 2025 | 36 | 1,617 | 2.2% |
| August 2025 | 28 | 1,451 | 1.9% |
| September 2025 | 37 | 1,560 | 2.4% |
| October 2025 | 29 | 1,450 | 2.0% |
| November 2025 | 30 | 1,505 | 2.0% |
| December 2025 | 27 | 1,603 | 1.7% |
| January 2026 | 51 | 1,739 | 2.9% |
| February 2026 | 41 | 1,607 | 2.6% |
| March 2026 | 30 | 1,843 | 1.6% |
| April 2026 | 42 | 1,725 | 2.4% |
| May 2026 | 31 | 1,797 | 1.7% |
| June 2026 | 26 | 1,697 | 1.5% |
| July 2026 | 34 | 1,733 | 2.0% |
| August 2026 | 40 | 1,557 | 2.6% |
| September 2026 | 30 | 1,777 | 1.7% |
Seasonal comparisons — matched periods
| Period | Appointments / qualifying | Share | Last year | Change |
|---|---|---|---|---|
| June 2025–August 2025 | 91 / 4,855 | 1.9% | June 2024–August 2024: Unavailable / Unavailable (Unavailable) | — |
| September 2025–November 2025 | 96 / 4,515 | 2.1% | September 2024–November 2024: Unavailable / Unavailable (Unavailable) | — |
| December 2025–February 2026 | 119 / 4,949 | 2.4% | December 2024–February 2025: Unavailable / Unavailable (Unavailable) | — |
| March 2026–May 2026 | 103 / 5,365 | 1.9% | March 2025–May 2025: Unavailable / Unavailable (Unavailable) | — |
| June 2026–August 2026 | 100 / 4,987 | 2.0% | June 2025–August 2025: 91 / 4,855 (1.9%) | +0.1 pp |
| September 2026 | 30 / 1,777 | 1.7% | September 2025: 37 / 1,560 (2.4%) | -0.7 pp |
SciaticaView figures and history 0.7% 0.6% 0.7%0.1% last year
Sciatica
Sciatica specifically discussed or assessed.
13 of 1,777 qualifying appointments addressed this concern.
Trailing 12 months: 119 appointments (0.6%) of 20,033.
Exact monthly figures — all saved history
| Month | Topic appointments | Qualifying appointments | Share |
|---|---|---|---|
| June 2025 | 6 | 1,787 | 0.3% |
| July 2025 | 6 | 1,617 | 0.4% |
| August 2025 | 7 | 1,451 | 0.5% |
| September 2025 | 1 | 1,560 | 0.1% |
| October 2025 | 10 | 1,450 | 0.7% |
| November 2025 | 6 | 1,505 | 0.4% |
| December 2025 | 9 | 1,603 | 0.6% |
| January 2026 | 7 | 1,739 | 0.4% |
| February 2026 | 4 | 1,607 | 0.2% |
| March 2026 | 13 | 1,843 | 0.7% |
| April 2026 | 12 | 1,725 | 0.7% |
| May 2026 | 7 | 1,797 | 0.4% |
| June 2026 | 10 | 1,697 | 0.6% |
| July 2026 | 12 | 1,733 | 0.7% |
| August 2026 | 16 | 1,557 | 1.0% |
| September 2026 | 13 | 1,777 | 0.7% |
Seasonal comparisons — matched periods
| Period | Appointments / qualifying | Share | Last year | Change |
|---|---|---|---|---|
| June 2025–August 2025 | 19 / 4,855 | 0.4% | June 2024–August 2024: Unavailable / Unavailable (Unavailable) | — |
| September 2025–November 2025 | 17 / 4,515 | 0.4% | September 2024–November 2024: Unavailable / Unavailable (Unavailable) | — |
| December 2025–February 2026 | 20 / 4,949 | 0.4% | December 2024–February 2025: Unavailable / Unavailable (Unavailable) | — |
| March 2026–May 2026 | 32 / 5,365 | 0.6% | March 2025–May 2025: Unavailable / Unavailable (Unavailable) | — |
| June 2026–August 2026 | 38 / 4,987 | 0.8% | June 2025–August 2025: 19 / 4,855 (0.4%) | +0.4 pp |
| September 2026 | 13 / 1,777 | 0.7% | September 2025: 1 / 1,560 (0.1%) | +0.7 pp |
View trends
Back pain & sciatica
Back pain and sciatica concerns assessed at the appointment.
43 of 1,777 qualifying appointments addressed this concern.
Trailing 12 months: 528 appointments (2.6%) of 20,033.
Exact monthly figures — all saved history
| Month | Topic appointments | Qualifying appointments | Share |
|---|---|---|---|
| June 2025 | 33 | 1,787 | 1.8% |
| July 2025 | 41 | 1,617 | 2.5% |
| August 2025 | 35 | 1,451 | 2.4% |
| September 2025 | 38 | 1,560 | 2.4% |
| October 2025 | 39 | 1,450 | 2.7% |
| November 2025 | 36 | 1,505 | 2.4% |
| December 2025 | 36 | 1,603 | 2.2% |
| January 2026 | 58 | 1,739 | 3.3% |
| February 2026 | 45 | 1,607 | 2.8% |
| March 2026 | 42 | 1,843 | 2.3% |
| April 2026 | 54 | 1,725 | 3.1% |
| May 2026 | 38 | 1,797 | 2.1% |
| June 2026 | 36 | 1,697 | 2.1% |
| July 2026 | 46 | 1,733 | 2.7% |
| August 2026 | 55 | 1,557 | 3.5% |
| September 2026 | 43 | 1,777 | 2.4% |
Seasonal comparisons — matched periods
| Period | Appointments / qualifying | Share | Last year | Change |
|---|---|---|---|---|
| June 2025–August 2025 | 109 / 4,855 | 2.2% | June 2024–August 2024: Unavailable / Unavailable (Unavailable) | — |
| September 2025–November 2025 | 113 / 4,515 | 2.5% | September 2024–November 2024: Unavailable / Unavailable (Unavailable) | — |
| December 2025–February 2026 | 139 / 4,949 | 2.8% | December 2024–February 2025: Unavailable / Unavailable (Unavailable) | — |
| March 2026–May 2026 | 134 / 5,365 | 2.5% | March 2025–May 2025: Unavailable / Unavailable (Unavailable) | — |
| June 2026–August 2026 | 137 / 4,987 | 2.7% | June 2025–August 2025: 109 / 4,855 (2.2%) | +0.5 pp |
| September 2026 | 43 / 1,777 | 2.4% | September 2025: 38 / 1,560 (2.4%) | 0.0 pp |
Other musculoskeletal concernsView figures and history 2.1% 2.0% 2.1%2.0% last year
Other musculoskeletal concerns
Other muscle, bone or joint concerns.
37 of 1,777 qualifying appointments addressed this concern.
Trailing 12 months: 405 appointments (2.0%) of 20,033.
Exact monthly figures — all saved history
| Month | Topic appointments | Qualifying appointments | Share |
|---|---|---|---|
| June 2025 | 35 | 1,787 | 2.0% |
| July 2025 | 34 | 1,617 | 2.1% |
| August 2025 | 30 | 1,451 | 2.1% |
| September 2025 | 31 | 1,560 | 2.0% |
| October 2025 | 20 | 1,450 | 1.4% |
| November 2025 | 25 | 1,505 | 1.7% |
| December 2025 | 30 | 1,603 | 1.9% |
| January 2026 | 45 | 1,739 | 2.6% |
| February 2026 | 41 | 1,607 | 2.6% |
| March 2026 | 46 | 1,843 | 2.5% |
| April 2026 | 31 | 1,725 | 1.8% |
| May 2026 | 25 | 1,797 | 1.4% |
| June 2026 | 34 | 1,697 | 2.0% |
| July 2026 | 35 | 1,733 | 2.0% |
| August 2026 | 36 | 1,557 | 2.3% |
| September 2026 | 37 | 1,777 | 2.1% |
Seasonal comparisons — matched periods
| Period | Appointments / qualifying | Share | Last year | Change |
|---|---|---|---|---|
| June 2025–August 2025 | 99 / 4,855 | 2.0% | June 2024–August 2024: Unavailable / Unavailable (Unavailable) | — |
| September 2025–November 2025 | 76 / 4,515 | 1.7% | September 2024–November 2024: Unavailable / Unavailable (Unavailable) | — |
| December 2025–February 2026 | 116 / 4,949 | 2.3% | December 2024–February 2025: Unavailable / Unavailable (Unavailable) | — |
| March 2026–May 2026 | 102 / 5,365 | 1.9% | March 2025–May 2025: Unavailable / Unavailable (Unavailable) | — |
| June 2026–August 2026 | 105 / 4,987 | 2.1% | June 2025–August 2025: 99 / 4,855 (2.0%) | +0.1 pp |
| September 2026 | 37 / 1,777 | 2.1% | September 2025: 31 / 1,560 (2.0%) | +0.1 pp |
Neck painView figures and history 1.3% 1.0% 1.3%1.0% last year
Neck pain
Neck pain discussed or assessed.
23 of 1,777 qualifying appointments addressed this concern.
Trailing 12 months: 198 appointments (1.0%) of 20,033.
Exact monthly figures — all saved history
| Month | Topic appointments | Qualifying appointments | Share |
|---|---|---|---|
| June 2025 | 11 | 1,787 | 0.6% |
| July 2025 | 12 | 1,617 | 0.7% |
| August 2025 | 12 | 1,451 | 0.8% |
| September 2025 | 16 | 1,560 | 1.0% |
| October 2025 | 14 | 1,450 | 1.0% |
| November 2025 | 11 | 1,505 | 0.7% |
| December 2025 | 14 | 1,603 | 0.9% |
| January 2026 | 20 | 1,739 | 1.2% |
| February 2026 | 20 | 1,607 | 1.2% |
| March 2026 | 20 | 1,843 | 1.1% |
| April 2026 | 18 | 1,725 | 1.0% |
| May 2026 | 15 | 1,797 | 0.8% |
| June 2026 | 16 | 1,697 | 0.9% |
| July 2026 | 11 | 1,733 | 0.6% |
| August 2026 | 16 | 1,557 | 1.0% |
| September 2026 | 23 | 1,777 | 1.3% |
Seasonal comparisons — matched periods
| Period | Appointments / qualifying | Share | Last year | Change |
|---|---|---|---|---|
| June 2025–August 2025 | 35 / 4,855 | 0.7% | June 2024–August 2024: Unavailable / Unavailable (Unavailable) | — |
| September 2025–November 2025 | 41 / 4,515 | 0.9% | September 2024–November 2024: Unavailable / Unavailable (Unavailable) | — |
| December 2025–February 2026 | 54 / 4,949 | 1.1% | December 2024–February 2025: Unavailable / Unavailable (Unavailable) | — |
| March 2026–May 2026 | 53 / 5,365 | 1.0% | March 2025–May 2025: Unavailable / Unavailable (Unavailable) | — |
| June 2026–August 2026 | 43 / 4,987 | 0.9% | June 2025–August 2025: 35 / 4,855 (0.7%) | +0.1 pp |
| September 2026 | 23 / 1,777 | 1.3% | September 2025: 16 / 1,560 (1.0%) | +0.3 pp |
ArthritisShow 3 topics Hide topics 0.3% 0.3% 0.3%0.3% last year
Inflammatory arthritisView figures and history 0.2% 0.1% 0.2%0.1% last year
Inflammatory arthritis
Inflammatory arthritis specifically discussed or assessed.
4 of 1,777 qualifying appointments addressed this concern.
Trailing 12 months: 28 appointments (0.1%) of 20,033.
Exact monthly figures — all saved history
| Month | Topic appointments | Qualifying appointments | Share |
|---|---|---|---|
| June 2025 | 2 | 1,787 | 0.1% |
| July 2025 | 0 | 1,617 | 0.0% |
| August 2025 | 2 | 1,451 | 0.1% |
| September 2025 | 1 | 1,560 | 0.1% |
| October 2025 | 1 | 1,450 | 0.1% |
| November 2025 | 6 | 1,505 | 0.4% |
| December 2025 | 2 | 1,603 | 0.1% |
| January 2026 | 6 | 1,739 | 0.3% |
| February 2026 | 3 | 1,607 | 0.2% |
| March 2026 | 0 | 1,843 | 0.0% |
| April 2026 | 0 | 1,725 | 0.0% |
| May 2026 | 0 | 1,797 | 0.0% |
| June 2026 | 4 | 1,697 | 0.2% |
| July 2026 | 0 | 1,733 | 0.0% |
| August 2026 | 2 | 1,557 | 0.1% |
| September 2026 | 4 | 1,777 | 0.2% |
Seasonal comparisons — matched periods
| Period | Appointments / qualifying | Share | Last year | Change |
|---|---|---|---|---|
| June 2025–August 2025 | 4 / 4,855 | 0.1% | June 2024–August 2024: Unavailable / Unavailable (Unavailable) | — |
| September 2025–November 2025 | 8 / 4,515 | 0.2% | September 2024–November 2024: Unavailable / Unavailable (Unavailable) | — |
| December 2025–February 2026 | 11 / 4,949 | 0.2% | December 2024–February 2025: Unavailable / Unavailable (Unavailable) | — |
| March 2026–May 2026 | 0 / 5,365 | 0.0% | March 2025–May 2025: Unavailable / Unavailable (Unavailable) | — |
| June 2026–August 2026 | 6 / 4,987 | 0.1% | June 2025–August 2025: 4 / 4,855 (0.1%) | 0.0 pp |
| September 2026 | 4 / 1,777 | 0.2% | September 2025: 1 / 1,560 (0.1%) | +0.2 pp |
OsteoarthritisView figures and history 0.1% 0.1% 0.1%0.1% last year
Osteoarthritis
Osteoarthritis specifically discussed or assessed.
1 of 1,777 qualifying appointments addressed this concern.
Trailing 12 months: 26 appointments (0.1%) of 20,033.
Exact monthly figures — all saved history
| Month | Topic appointments | Qualifying appointments | Share |
|---|---|---|---|
| June 2025 | 1 | 1,787 | 0.1% |
| July 2025 | 2 | 1,617 | 0.1% |
| August 2025 | 2 | 1,451 | 0.1% |
| September 2025 | 1 | 1,560 | 0.1% |
| October 2025 | 3 | 1,450 | 0.2% |
| November 2025 | 1 | 1,505 | 0.1% |
| December 2025 | 1 | 1,603 | 0.1% |
| January 2026 | 6 | 1,739 | 0.3% |
| February 2026 | 2 | 1,607 | 0.1% |
| March 2026 | 2 | 1,843 | 0.1% |
| April 2026 | 4 | 1,725 | 0.2% |
| May 2026 | 3 | 1,797 | 0.2% |
| June 2026 | 0 | 1,697 | 0.0% |
| July 2026 | 0 | 1,733 | 0.0% |
| August 2026 | 3 | 1,557 | 0.2% |
| September 2026 | 1 | 1,777 | 0.1% |
Seasonal comparisons — matched periods
| Period | Appointments / qualifying | Share | Last year | Change |
|---|---|---|---|---|
| June 2025–August 2025 | 5 / 4,855 | 0.1% | June 2024–August 2024: Unavailable / Unavailable (Unavailable) | — |
| September 2025–November 2025 | 5 / 4,515 | 0.1% | September 2024–November 2024: Unavailable / Unavailable (Unavailable) | — |
| December 2025–February 2026 | 9 / 4,949 | 0.2% | December 2024–February 2025: Unavailable / Unavailable (Unavailable) | — |
| March 2026–May 2026 | 9 / 5,365 | 0.2% | March 2025–May 2025: Unavailable / Unavailable (Unavailable) | — |
| June 2026–August 2026 | 3 / 4,987 | 0.1% | June 2025–August 2025: 5 / 4,855 (0.1%) | 0.0 pp |
| September 2026 | 1 / 1,777 | 0.1% | September 2025: 1 / 1,560 (0.1%) | 0.0 pp |
Other/unspecified arthritisView figures and history 0.1% 0.0% 0.1%0.1% last year
Other/unspecified arthritis
Other or unspecified arthritis concerns.
1 of 1,777 qualifying appointments addressed this concern.
Trailing 12 months: 8 appointments (0.0%) of 20,033.
Exact monthly figures — all saved history
| Month | Topic appointments | Qualifying appointments | Share |
|---|---|---|---|
| June 2025 | 1 | 1,787 | 0.1% |
| July 2025 | 0 | 1,617 | 0.0% |
| August 2025 | 1 | 1,451 | 0.1% |
| September 2025 | 2 | 1,560 | 0.1% |
| October 2025 | 0 | 1,450 | 0.0% |
| November 2025 | 1 | 1,505 | 0.1% |
| December 2025 | 2 | 1,603 | 0.1% |
| January 2026 | 1 | 1,739 | 0.1% |
| February 2026 | 1 | 1,607 | 0.1% |
| March 2026 | 0 | 1,843 | 0.0% |
| April 2026 | 0 | 1,725 | 0.0% |
| May 2026 | 0 | 1,797 | 0.0% |
| June 2026 | 2 | 1,697 | 0.1% |
| July 2026 | 0 | 1,733 | 0.0% |
| August 2026 | 0 | 1,557 | 0.0% |
| September 2026 | 1 | 1,777 | 0.1% |
Seasonal comparisons — matched periods
| Period | Appointments / qualifying | Share | Last year | Change |
|---|---|---|---|---|
| June 2025–August 2025 | 2 / 4,855 | 0.0% | June 2024–August 2024: Unavailable / Unavailable (Unavailable) | — |
| September 2025–November 2025 | 3 / 4,515 | 0.1% | September 2024–November 2024: Unavailable / Unavailable (Unavailable) | — |
| December 2025–February 2026 | 4 / 4,949 | 0.1% | December 2024–February 2025: Unavailable / Unavailable (Unavailable) | — |
| March 2026–May 2026 | 0 / 5,365 | 0.0% | March 2025–May 2025: Unavailable / Unavailable (Unavailable) | — |
| June 2026–August 2026 | 2 / 4,987 | 0.0% | June 2025–August 2025: 2 / 4,855 (0.0%) | 0.0 pp |
| September 2026 | 1 / 1,777 | 0.1% | September 2025: 2 / 1,560 (0.1%) | -0.1 pp |
View trends
Arthritis
Osteoarthritis, inflammatory arthritis and other arthritis concerns.
6 of 1,777 qualifying appointments addressed this concern.
Trailing 12 months: 62 appointments (0.3%) of 20,033.
Exact monthly figures — all saved history
| Month | Topic appointments | Qualifying appointments | Share |
|---|---|---|---|
| June 2025 | 4 | 1,787 | 0.2% |
| July 2025 | 2 | 1,617 | 0.1% |
| August 2025 | 5 | 1,451 | 0.3% |
| September 2025 | 4 | 1,560 | 0.3% |
| October 2025 | 4 | 1,450 | 0.3% |
| November 2025 | 8 | 1,505 | 0.5% |
| December 2025 | 5 | 1,603 | 0.3% |
| January 2026 | 13 | 1,739 | 0.7% |
| February 2026 | 6 | 1,607 | 0.4% |
| March 2026 | 2 | 1,843 | 0.1% |
| April 2026 | 4 | 1,725 | 0.2% |
| May 2026 | 3 | 1,797 | 0.2% |
| June 2026 | 6 | 1,697 | 0.4% |
| July 2026 | 0 | 1,733 | 0.0% |
| August 2026 | 5 | 1,557 | 0.3% |
| September 2026 | 6 | 1,777 | 0.3% |
Seasonal comparisons — matched periods
| Period | Appointments / qualifying | Share | Last year | Change |
|---|---|---|---|---|
| June 2025–August 2025 | 11 / 4,855 | 0.2% | June 2024–August 2024: Unavailable / Unavailable (Unavailable) | — |
| September 2025–November 2025 | 16 / 4,515 | 0.4% | September 2024–November 2024: Unavailable / Unavailable (Unavailable) | — |
| December 2025–February 2026 | 24 / 4,949 | 0.5% | December 2024–February 2025: Unavailable / Unavailable (Unavailable) | — |
| March 2026–May 2026 | 9 / 5,365 | 0.2% | March 2025–May 2025: Unavailable / Unavailable (Unavailable) | — |
| June 2026–August 2026 | 11 / 4,987 | 0.2% | June 2025–August 2025: 11 / 4,855 (0.2%) | 0.0 pp |
| September 2026 | 6 / 1,777 | 0.3% | September 2025: 4 / 1,560 (0.3%) | +0.1 pp |
GoutView figures and history 0.2% 0.4% 0.2%0.8% last year
Gout
Gout specifically discussed or assessed.
4 of 1,777 qualifying appointments addressed this concern.
Trailing 12 months: 73 appointments (0.4%) of 20,033.
Exact monthly figures — all saved history
| Month | Topic appointments | Qualifying appointments | Share |
|---|---|---|---|
| June 2025 | 13 | 1,787 | 0.7% |
| July 2025 | 8 | 1,617 | 0.5% |
| August 2025 | 7 | 1,451 | 0.5% |
| September 2025 | 12 | 1,560 | 0.8% |
| October 2025 | 5 | 1,450 | 0.3% |
| November 2025 | 5 | 1,505 | 0.3% |
| December 2025 | 5 | 1,603 | 0.3% |
| January 2026 | 9 | 1,739 | 0.5% |
| February 2026 | 3 | 1,607 | 0.2% |
| March 2026 | 7 | 1,843 | 0.4% |
| April 2026 | 8 | 1,725 | 0.5% |
| May 2026 | 5 | 1,797 | 0.3% |
| June 2026 | 12 | 1,697 | 0.7% |
| July 2026 | 4 | 1,733 | 0.2% |
| August 2026 | 6 | 1,557 | 0.4% |
| September 2026 | 4 | 1,777 | 0.2% |
Seasonal comparisons — matched periods
| Period | Appointments / qualifying | Share | Last year | Change |
|---|---|---|---|---|
| June 2025–August 2025 | 28 / 4,855 | 0.6% | June 2024–August 2024: Unavailable / Unavailable (Unavailable) | — |
| September 2025–November 2025 | 22 / 4,515 | 0.5% | September 2024–November 2024: Unavailable / Unavailable (Unavailable) | — |
| December 2025–February 2026 | 17 / 4,949 | 0.3% | December 2024–February 2025: Unavailable / Unavailable (Unavailable) | — |
| March 2026–May 2026 | 20 / 5,365 | 0.4% | March 2025–May 2025: Unavailable / Unavailable (Unavailable) | — |
| June 2026–August 2026 | 22 / 4,987 | 0.4% | June 2025–August 2025: 28 / 4,855 (0.6%) | -0.1 pp |
| September 2026 | 4 / 1,777 | 0.2% | September 2025: 12 / 1,560 (0.8%) | -0.5 pp |
View trends
Muscles, bones & joints
Back, neck, joint, muscle and limb concerns, including injuries and arthritis.
215 of 1,777 qualifying appointments addressed this concern.
Trailing 12 months: 2,393 appointments (11.9%) of 20,033.
Exact monthly figures — all saved history
| Month | Topic appointments | Qualifying appointments | Share |
|---|---|---|---|
| June 2025 | 186 | 1,787 | 10.4% |
| July 2025 | 186 | 1,617 | 11.5% |
| August 2025 | 170 | 1,451 | 11.7% |
| September 2025 | 189 | 1,560 | 12.1% |
| October 2025 | 151 | 1,450 | 10.4% |
| November 2025 | 154 | 1,505 | 10.2% |
| December 2025 | 175 | 1,603 | 10.9% |
| January 2026 | 260 | 1,739 | 15.0% |
| February 2026 | 202 | 1,607 | 12.6% |
| March 2026 | 246 | 1,843 | 13.3% |
| April 2026 | 230 | 1,725 | 13.3% |
| May 2026 | 184 | 1,797 | 10.2% |
| June 2026 | 194 | 1,697 | 11.4% |
| July 2026 | 195 | 1,733 | 11.3% |
| August 2026 | 187 | 1,557 | 12.0% |
| September 2026 | 215 | 1,777 | 12.1% |
Seasonal comparisons — matched periods
| Period | Appointments / qualifying | Share | Last year | Change |
|---|---|---|---|---|
| June 2025–August 2025 | 542 / 4,855 | 11.2% | June 2024–August 2024: Unavailable / Unavailable (Unavailable) | — |
| September 2025–November 2025 | 494 / 4,515 | 10.9% | September 2024–November 2024: Unavailable / Unavailable (Unavailable) | — |
| December 2025–February 2026 | 637 / 4,949 | 12.9% | December 2024–February 2025: Unavailable / Unavailable (Unavailable) | — |
| March 2026–May 2026 | 660 / 5,365 | 12.3% | March 2025–May 2025: Unavailable / Unavailable (Unavailable) | — |
| June 2026–August 2026 | 576 / 4,987 | 11.6% | June 2025–August 2025: 542 / 4,855 (11.2%) | +0.4 pp |
| September 2026 | 215 / 1,777 | 12.1% | September 2025: 189 / 1,560 (12.1%) | 0.0 pp |
Acute respiratory illnessShow 5 topics Hide topics 10.7% 12.1% 10.7%10.3% last year
Colds & upper respiratory infectionsView figures and history 6.0% 5.3% 6.0%4.4% last year
Colds & upper respiratory infections
Colds and other acute upper respiratory infections addressed at the appointment.
107 of 1,777 qualifying appointments addressed this concern.
Trailing 12 months: 1,066 appointments (5.3%) of 20,033.
Exact monthly figures — all saved history
| Month | Topic appointments | Qualifying appointments | Share |
|---|---|---|---|
| June 2025 | 91 | 1,787 | 5.1% |
| July 2025 | 59 | 1,617 | 3.6% |
| August 2025 | 60 | 1,451 | 4.1% |
| September 2025 | 69 | 1,560 | 4.4% |
| October 2025 | 99 | 1,450 | 6.8% |
| November 2025 | 101 | 1,505 | 6.7% |
| December 2025 | 133 | 1,603 | 8.3% |
| January 2026 | 86 | 1,739 | 4.9% |
| February 2026 | 92 | 1,607 | 5.7% |
| March 2026 | 104 | 1,843 | 5.6% |
| April 2026 | 76 | 1,725 | 4.4% |
| May 2026 | 69 | 1,797 | 3.8% |
| June 2026 | 68 | 1,697 | 4.0% |
| July 2026 | 64 | 1,733 | 3.7% |
| August 2026 | 67 | 1,557 | 4.3% |
| September 2026 | 107 | 1,777 | 6.0% |
Seasonal comparisons — matched periods
| Period | Appointments / qualifying | Share | Last year | Change |
|---|---|---|---|---|
| June 2025–August 2025 | 210 / 4,855 | 4.3% | June 2024–August 2024: Unavailable / Unavailable (Unavailable) | — |
| September 2025–November 2025 | 269 / 4,515 | 6.0% | September 2024–November 2024: Unavailable / Unavailable (Unavailable) | — |
| December 2025–February 2026 | 311 / 4,949 | 6.3% | December 2024–February 2025: Unavailable / Unavailable (Unavailable) | — |
| March 2026–May 2026 | 249 / 5,365 | 4.6% | March 2025–May 2025: Unavailable / Unavailable (Unavailable) | — |
| June 2026–August 2026 | 199 / 4,987 | 4.0% | June 2025–August 2025: 210 / 4,855 (4.3%) | -0.3 pp |
| September 2026 | 107 / 1,777 | 6.0% | September 2025: 69 / 1,560 (4.4%) | +1.6 pp |
Chest infectionsShow 2 topics Hide topics 2.0% 3.2% 2.0%2.7% last year
Other chest infectionsView figures and history 1.7% 2.9% 1.7%2.7% last year
Other chest infections
Chest infections other than specifically recorded pneumonia, including bronchitis.
31 of 1,777 qualifying appointments addressed this concern.
Trailing 12 months: 585 appointments (2.9%) of 20,033.
Exact monthly figures — all saved history
| Month | Topic appointments | Qualifying appointments | Share |
|---|---|---|---|
| June 2025 | 40 | 1,787 | 2.2% |
| July 2025 | 34 | 1,617 | 2.1% |
| August 2025 | 33 | 1,451 | 2.3% |
| September 2025 | 42 | 1,560 | 2.7% |
| October 2025 | 47 | 1,450 | 3.2% |
| November 2025 | 52 | 1,505 | 3.5% |
| December 2025 | 106 | 1,603 | 6.6% |
| January 2026 | 69 | 1,739 | 4.0% |
| February 2026 | 48 | 1,607 | 3.0% |
| March 2026 | 57 | 1,843 | 3.1% |
| April 2026 | 53 | 1,725 | 3.1% |
| May 2026 | 31 | 1,797 | 1.7% |
| June 2026 | 43 | 1,697 | 2.5% |
| July 2026 | 25 | 1,733 | 1.4% |
| August 2026 | 23 | 1,557 | 1.5% |
| September 2026 | 31 | 1,777 | 1.7% |
Seasonal comparisons — matched periods
| Period | Appointments / qualifying | Share | Last year | Change |
|---|---|---|---|---|
| June 2025–August 2025 | 107 / 4,855 | 2.2% | June 2024–August 2024: Unavailable / Unavailable (Unavailable) | — |
| September 2025–November 2025 | 141 / 4,515 | 3.1% | September 2024–November 2024: Unavailable / Unavailable (Unavailable) | — |
| December 2025–February 2026 | 223 / 4,949 | 4.5% | December 2024–February 2025: Unavailable / Unavailable (Unavailable) | — |
| March 2026–May 2026 | 141 / 5,365 | 2.6% | March 2025–May 2025: Unavailable / Unavailable (Unavailable) | — |
| June 2026–August 2026 | 91 / 4,987 | 1.8% | June 2025–August 2025: 107 / 4,855 (2.2%) | -0.4 pp |
| September 2026 | 31 / 1,777 | 1.7% | September 2025: 42 / 1,560 (2.7%) | -0.9 pp |
PneumoniaView figures and history 0.3% 0.2% 0.3%0.0% last year
Pneumonia
Pneumonia specifically discussed or assessed, including suspected pneumonia.
5 of 1,777 qualifying appointments addressed this concern.
Trailing 12 months: 48 appointments (0.2%) of 20,033.
Exact monthly figures — all saved history
| Month | Topic appointments | Qualifying appointments | Share |
|---|---|---|---|
| June 2025 | 2 | 1,787 | 0.1% |
| July 2025 | 2 | 1,617 | 0.1% |
| August 2025 | 1 | 1,451 | 0.1% |
| September 2025 | 0 | 1,560 | 0.0% |
| October 2025 | 7 | 1,450 | 0.5% |
| November 2025 | 4 | 1,505 | 0.3% |
| December 2025 | 3 | 1,603 | 0.2% |
| January 2026 | 5 | 1,739 | 0.3% |
| February 2026 | 2 | 1,607 | 0.1% |
| March 2026 | 5 | 1,843 | 0.3% |
| April 2026 | 4 | 1,725 | 0.2% |
| May 2026 | 6 | 1,797 | 0.3% |
| June 2026 | 2 | 1,697 | 0.1% |
| July 2026 | 1 | 1,733 | 0.1% |
| August 2026 | 4 | 1,557 | 0.3% |
| September 2026 | 5 | 1,777 | 0.3% |
Seasonal comparisons — matched periods
| Period | Appointments / qualifying | Share | Last year | Change |
|---|---|---|---|---|
| June 2025–August 2025 | 5 / 4,855 | 0.1% | June 2024–August 2024: Unavailable / Unavailable (Unavailable) | — |
| September 2025–November 2025 | 11 / 4,515 | 0.2% | September 2024–November 2024: Unavailable / Unavailable (Unavailable) | — |
| December 2025–February 2026 | 10 / 4,949 | 0.2% | December 2024–February 2025: Unavailable / Unavailable (Unavailable) | — |
| March 2026–May 2026 | 15 / 5,365 | 0.3% | March 2025–May 2025: Unavailable / Unavailable (Unavailable) | — |
| June 2026–August 2026 | 7 / 4,987 | 0.1% | June 2025–August 2025: 5 / 4,855 (0.1%) | 0.0 pp |
| September 2026 | 5 / 1,777 | 0.3% | September 2025: 0 / 1,560 (0.0%) | +0.3 pp |
View trends
Chest infections
Pneumonia and other chest infections discussed or assessed at the appointment.
36 of 1,777 qualifying appointments addressed this concern.
Trailing 12 months: 633 appointments (3.2%) of 20,033.
Exact monthly figures — all saved history
| Month | Topic appointments | Qualifying appointments | Share |
|---|---|---|---|
| June 2025 | 42 | 1,787 | 2.4% |
| July 2025 | 36 | 1,617 | 2.2% |
| August 2025 | 34 | 1,451 | 2.3% |
| September 2025 | 42 | 1,560 | 2.7% |
| October 2025 | 54 | 1,450 | 3.7% |
| November 2025 | 56 | 1,505 | 3.7% |
| December 2025 | 109 | 1,603 | 6.8% |
| January 2026 | 74 | 1,739 | 4.3% |
| February 2026 | 50 | 1,607 | 3.1% |
| March 2026 | 62 | 1,843 | 3.4% |
| April 2026 | 57 | 1,725 | 3.3% |
| May 2026 | 37 | 1,797 | 2.1% |
| June 2026 | 45 | 1,697 | 2.7% |
| July 2026 | 26 | 1,733 | 1.5% |
| August 2026 | 27 | 1,557 | 1.7% |
| September 2026 | 36 | 1,777 | 2.0% |
Seasonal comparisons — matched periods
| Period | Appointments / qualifying | Share | Last year | Change |
|---|---|---|---|---|
| June 2025–August 2025 | 112 / 4,855 | 2.3% | June 2024–August 2024: Unavailable / Unavailable (Unavailable) | — |
| September 2025–November 2025 | 152 / 4,515 | 3.4% | September 2024–November 2024: Unavailable / Unavailable (Unavailable) | — |
| December 2025–February 2026 | 233 / 4,949 | 4.7% | December 2024–February 2025: Unavailable / Unavailable (Unavailable) | — |
| March 2026–May 2026 | 156 / 5,365 | 2.9% | March 2025–May 2025: Unavailable / Unavailable (Unavailable) | — |
| June 2026–August 2026 | 98 / 4,987 | 2.0% | June 2025–August 2025: 112 / 4,855 (2.3%) | -0.3 pp |
| September 2026 | 36 / 1,777 | 2.0% | September 2025: 42 / 1,560 (2.7%) | -0.7 pp |
Other acute cough & respiratory illnessView figures and history 1.9% 2.8% 1.9%2.0% last year
Other acute cough & respiratory illness
Other acute respiratory illness or cough, including cough following a viral illness.
34 of 1,777 qualifying appointments addressed this concern.
Trailing 12 months: 553 appointments (2.8%) of 20,033.
Exact monthly figures — all saved history
| Month | Topic appointments | Qualifying appointments | Share |
|---|---|---|---|
| June 2025 | 36 | 1,787 | 2.0% |
| July 2025 | 26 | 1,617 | 1.6% |
| August 2025 | 22 | 1,451 | 1.5% |
| September 2025 | 31 | 1,560 | 2.0% |
| October 2025 | 40 | 1,450 | 2.8% |
| November 2025 | 46 | 1,505 | 3.1% |
| December 2025 | 70 | 1,603 | 4.4% |
| January 2026 | 59 | 1,739 | 3.4% |
| February 2026 | 46 | 1,607 | 2.9% |
| March 2026 | 64 | 1,843 | 3.5% |
| April 2026 | 47 | 1,725 | 2.7% |
| May 2026 | 44 | 1,797 | 2.4% |
| June 2026 | 30 | 1,697 | 1.8% |
| July 2026 | 37 | 1,733 | 2.1% |
| August 2026 | 36 | 1,557 | 2.3% |
| September 2026 | 34 | 1,777 | 1.9% |
Seasonal comparisons — matched periods
| Period | Appointments / qualifying | Share | Last year | Change |
|---|---|---|---|---|
| June 2025–August 2025 | 84 / 4,855 | 1.7% | June 2024–August 2024: Unavailable / Unavailable (Unavailable) | — |
| September 2025–November 2025 | 117 / 4,515 | 2.6% | September 2024–November 2024: Unavailable / Unavailable (Unavailable) | — |
| December 2025–February 2026 | 175 / 4,949 | 3.5% | December 2024–February 2025: Unavailable / Unavailable (Unavailable) | — |
| March 2026–May 2026 | 155 / 5,365 | 2.9% | March 2025–May 2025: Unavailable / Unavailable (Unavailable) | — |
| June 2026–August 2026 | 103 / 4,987 | 2.1% | June 2025–August 2025: 84 / 4,855 (1.7%) | +0.3 pp |
| September 2026 | 34 / 1,777 | 1.9% | September 2025: 31 / 1,560 (2.0%) | -0.1 pp |
Influenza & flu-like illnessView figures and history 0.8% 0.8% 0.8%0.9% last year
Influenza & flu-like illness
Influenza or flu-like illness discussed or assessed, including suspected influenza.
14 of 1,777 qualifying appointments addressed this concern.
Trailing 12 months: 168 appointments (0.8%) of 20,033.
Exact monthly figures — all saved history
| Month | Topic appointments | Qualifying appointments | Share |
|---|---|---|---|
| June 2025 | 4 | 1,787 | 0.2% |
| July 2025 | 9 | 1,617 | 0.6% |
| August 2025 | 4 | 1,451 | 0.3% |
| September 2025 | 14 | 1,560 | 0.9% |
| October 2025 | 7 | 1,450 | 0.5% |
| November 2025 | 21 | 1,505 | 1.4% |
| December 2025 | 32 | 1,603 | 2.0% |
| January 2026 | 23 | 1,739 | 1.3% |
| February 2026 | 16 | 1,607 | 1.0% |
| March 2026 | 16 | 1,843 | 0.9% |
| April 2026 | 12 | 1,725 | 0.7% |
| May 2026 | 11 | 1,797 | 0.6% |
| June 2026 | 10 | 1,697 | 0.6% |
| July 2026 | 4 | 1,733 | 0.2% |
| August 2026 | 2 | 1,557 | 0.1% |
| September 2026 | 14 | 1,777 | 0.8% |
Seasonal comparisons — matched periods
| Period | Appointments / qualifying | Share | Last year | Change |
|---|---|---|---|---|
| June 2025–August 2025 | 17 / 4,855 | 0.4% | June 2024–August 2024: Unavailable / Unavailable (Unavailable) | — |
| September 2025–November 2025 | 42 / 4,515 | 0.9% | September 2024–November 2024: Unavailable / Unavailable (Unavailable) | — |
| December 2025–February 2026 | 71 / 4,949 | 1.4% | December 2024–February 2025: Unavailable / Unavailable (Unavailable) | — |
| March 2026–May 2026 | 39 / 5,365 | 0.7% | March 2025–May 2025: Unavailable / Unavailable (Unavailable) | — |
| June 2026–August 2026 | 16 / 4,987 | 0.3% | June 2025–August 2025: 17 / 4,855 (0.4%) | 0.0 pp |
| September 2026 | 14 / 1,777 | 0.8% | September 2025: 14 / 1,560 (0.9%) | -0.1 pp |
COVID-19View figures and history 0.1% 0.1% 0.1%0.4% last year
COVID-19
COVID-19 illness or specifically suspected COVID-19 discussed or assessed.
1 of 1,777 qualifying appointments addressed this concern.
Trailing 12 months: 23 appointments (0.1%) of 20,033.
Exact monthly figures — all saved history
| Month | Topic appointments | Qualifying appointments | Share |
|---|---|---|---|
| June 2025 | 2 | 1,787 | 0.1% |
| July 2025 | 6 | 1,617 | 0.4% |
| August 2025 | 5 | 1,451 | 0.3% |
| September 2025 | 6 | 1,560 | 0.4% |
| October 2025 | 4 | 1,450 | 0.3% |
| November 2025 | 7 | 1,505 | 0.5% |
| December 2025 | 1 | 1,603 | 0.1% |
| January 2026 | 3 | 1,739 | 0.2% |
| February 2026 | 1 | 1,607 | 0.1% |
| March 2026 | 1 | 1,843 | 0.1% |
| April 2026 | 1 | 1,725 | 0.1% |
| May 2026 | 1 | 1,797 | 0.1% |
| June 2026 | 2 | 1,697 | 0.1% |
| July 2026 | 1 | 1,733 | 0.1% |
| August 2026 | 0 | 1,557 | 0.0% |
| September 2026 | 1 | 1,777 | 0.1% |
Seasonal comparisons — matched periods
| Period | Appointments / qualifying | Share | Last year | Change |
|---|---|---|---|---|
| June 2025–August 2025 | 13 / 4,855 | 0.3% | June 2024–August 2024: Unavailable / Unavailable (Unavailable) | — |
| September 2025–November 2025 | 17 / 4,515 | 0.4% | September 2024–November 2024: Unavailable / Unavailable (Unavailable) | — |
| December 2025–February 2026 | 5 / 4,949 | 0.1% | December 2024–February 2025: Unavailable / Unavailable (Unavailable) | — |
| March 2026–May 2026 | 3 / 5,365 | 0.1% | March 2025–May 2025: Unavailable / Unavailable (Unavailable) | — |
| June 2026–August 2026 | 3 / 4,987 | 0.1% | June 2025–August 2025: 13 / 4,855 (0.3%) | -0.2 pp |
| September 2026 | 1 / 1,777 | 0.1% | September 2025: 6 / 1,560 (0.4%) | -0.3 pp |
View trends
Acute respiratory illness
Acute respiratory infections and other short-term cough or respiratory concerns.
190 of 1,777 qualifying appointments addressed this concern.
Trailing 12 months: 2,420 appointments (12.1%) of 20,033.
Exact monthly figures — all saved history
| Month | Topic appointments | Qualifying appointments | Share |
|---|---|---|---|
| June 2025 | 173 | 1,787 | 9.7% |
| July 2025 | 135 | 1,617 | 8.3% |
| August 2025 | 125 | 1,451 | 8.6% |
| September 2025 | 161 | 1,560 | 10.3% |
| October 2025 | 202 | 1,450 | 13.9% |
| November 2025 | 228 | 1,505 | 15.1% |
| December 2025 | 340 | 1,603 | 21.2% |
| January 2026 | 242 | 1,739 | 13.9% |
| February 2026 | 202 | 1,607 | 12.6% |
| March 2026 | 247 | 1,843 | 13.4% |
| April 2026 | 192 | 1,725 | 11.1% |
| May 2026 | 161 | 1,797 | 9.0% |
| June 2026 | 154 | 1,697 | 9.1% |
| July 2026 | 131 | 1,733 | 7.6% |
| August 2026 | 131 | 1,557 | 8.4% |
| September 2026 | 190 | 1,777 | 10.7% |
Seasonal comparisons — matched periods
| Period | Appointments / qualifying | Share | Last year | Change |
|---|---|---|---|---|
| June 2025–August 2025 | 433 / 4,855 | 8.9% | June 2024–August 2024: Unavailable / Unavailable (Unavailable) | — |
| September 2025–November 2025 | 591 / 4,515 | 13.1% | September 2024–November 2024: Unavailable / Unavailable (Unavailable) | — |
| December 2025–February 2026 | 784 / 4,949 | 15.8% | December 2024–February 2025: Unavailable / Unavailable (Unavailable) | — |
| March 2026–May 2026 | 600 / 5,365 | 11.2% | March 2025–May 2025: Unavailable / Unavailable (Unavailable) | — |
| June 2026–August 2026 | 416 / 4,987 | 8.3% | June 2025–August 2025: 433 / 4,855 (8.9%) | -0.6 pp |
| September 2026 | 190 / 1,777 | 10.7% | September 2025: 161 / 1,560 (10.3%) | +0.4 pp |
Headaches & neurologicalShow 5 topics Hide topics 7.9% 6.8% 7.9%6.7% last year
Dizziness & balance concernsShow 2 topics Hide topics 2.9% 2.5% 2.9%2.2% last year
Other dizzinessView figures and history 2.0% 1.6% 2.0%1.5% last year
Other dizziness
Other dizziness concerns.
35 of 1,777 qualifying appointments addressed this concern.
Trailing 12 months: 330 appointments (1.6%) of 20,033.
Exact monthly figures — all saved history
| Month | Topic appointments | Qualifying appointments | Share |
|---|---|---|---|
| June 2025 | 18 | 1,787 | 1.0% |
| July 2025 | 29 | 1,617 | 1.8% |
| August 2025 | 29 | 1,451 | 2.0% |
| September 2025 | 24 | 1,560 | 1.5% |
| October 2025 | 24 | 1,450 | 1.7% |
| November 2025 | 25 | 1,505 | 1.7% |
| December 2025 | 13 | 1,603 | 0.8% |
| January 2026 | 26 | 1,739 | 1.5% |
| February 2026 | 24 | 1,607 | 1.5% |
| March 2026 | 23 | 1,843 | 1.2% |
| April 2026 | 30 | 1,725 | 1.7% |
| May 2026 | 37 | 1,797 | 2.1% |
| June 2026 | 31 | 1,697 | 1.8% |
| July 2026 | 32 | 1,733 | 1.8% |
| August 2026 | 30 | 1,557 | 1.9% |
| September 2026 | 35 | 1,777 | 2.0% |
Seasonal comparisons — matched periods
| Period | Appointments / qualifying | Share | Last year | Change |
|---|---|---|---|---|
| June 2025–August 2025 | 76 / 4,855 | 1.6% | June 2024–August 2024: Unavailable / Unavailable (Unavailable) | — |
| September 2025–November 2025 | 73 / 4,515 | 1.6% | September 2024–November 2024: Unavailable / Unavailable (Unavailable) | — |
| December 2025–February 2026 | 63 / 4,949 | 1.3% | December 2024–February 2025: Unavailable / Unavailable (Unavailable) | — |
| March 2026–May 2026 | 90 / 5,365 | 1.7% | March 2025–May 2025: Unavailable / Unavailable (Unavailable) | — |
| June 2026–August 2026 | 93 / 4,987 | 1.9% | June 2025–August 2025: 76 / 4,855 (1.6%) | +0.3 pp |
| September 2026 | 35 / 1,777 | 2.0% | September 2025: 24 / 1,560 (1.5%) | +0.4 pp |
Vertigo/balance disorderView figures and history 1.0% 0.8% 1.0%0.6% last year
Vertigo/balance disorder
Vertigo or a balance disorder specifically discussed or assessed.
17 of 1,777 qualifying appointments addressed this concern.
Trailing 12 months: 165 appointments (0.8%) of 20,033.
Exact monthly figures — all saved history
| Month | Topic appointments | Qualifying appointments | Share |
|---|---|---|---|
| June 2025 | 13 | 1,787 | 0.7% |
| July 2025 | 5 | 1,617 | 0.3% |
| August 2025 | 12 | 1,451 | 0.8% |
| September 2025 | 10 | 1,560 | 0.6% |
| October 2025 | 8 | 1,450 | 0.6% |
| November 2025 | 9 | 1,505 | 0.6% |
| December 2025 | 10 | 1,603 | 0.6% |
| January 2026 | 17 | 1,739 | 1.0% |
| February 2026 | 12 | 1,607 | 0.7% |
| March 2026 | 21 | 1,843 | 1.1% |
| April 2026 | 14 | 1,725 | 0.8% |
| May 2026 | 21 | 1,797 | 1.2% |
| June 2026 | 11 | 1,697 | 0.6% |
| July 2026 | 13 | 1,733 | 0.8% |
| August 2026 | 12 | 1,557 | 0.8% |
| September 2026 | 17 | 1,777 | 1.0% |
Seasonal comparisons — matched periods
| Period | Appointments / qualifying | Share | Last year | Change |
|---|---|---|---|---|
| June 2025–August 2025 | 30 / 4,855 | 0.6% | June 2024–August 2024: Unavailable / Unavailable (Unavailable) | — |
| September 2025–November 2025 | 27 / 4,515 | 0.6% | September 2024–November 2024: Unavailable / Unavailable (Unavailable) | — |
| December 2025–February 2026 | 39 / 4,949 | 0.8% | December 2024–February 2025: Unavailable / Unavailable (Unavailable) | — |
| March 2026–May 2026 | 56 / 5,365 | 1.0% | March 2025–May 2025: Unavailable / Unavailable (Unavailable) | — |
| June 2026–August 2026 | 36 / 4,987 | 0.7% | June 2025–August 2025: 30 / 4,855 (0.6%) | +0.1 pp |
| September 2026 | 17 / 1,777 | 1.0% | September 2025: 10 / 1,560 (0.6%) | +0.3 pp |
View trends
Dizziness & balance concerns
Vertigo, balance disorders and other dizziness concerns.
52 of 1,777 qualifying appointments addressed this concern.
Trailing 12 months: 495 appointments (2.5%) of 20,033.
Exact monthly figures — all saved history
| Month | Topic appointments | Qualifying appointments | Share |
|---|---|---|---|
| June 2025 | 31 | 1,787 | 1.7% |
| July 2025 | 34 | 1,617 | 2.1% |
| August 2025 | 41 | 1,451 | 2.8% |
| September 2025 | 34 | 1,560 | 2.2% |
| October 2025 | 32 | 1,450 | 2.2% |
| November 2025 | 34 | 1,505 | 2.3% |
| December 2025 | 23 | 1,603 | 1.4% |
| January 2026 | 43 | 1,739 | 2.5% |
| February 2026 | 36 | 1,607 | 2.2% |
| March 2026 | 44 | 1,843 | 2.4% |
| April 2026 | 44 | 1,725 | 2.6% |
| May 2026 | 58 | 1,797 | 3.2% |
| June 2026 | 42 | 1,697 | 2.5% |
| July 2026 | 45 | 1,733 | 2.6% |
| August 2026 | 42 | 1,557 | 2.7% |
| September 2026 | 52 | 1,777 | 2.9% |
Seasonal comparisons — matched periods
| Period | Appointments / qualifying | Share | Last year | Change |
|---|---|---|---|---|
| June 2025–August 2025 | 106 / 4,855 | 2.2% | June 2024–August 2024: Unavailable / Unavailable (Unavailable) | — |
| September 2025–November 2025 | 100 / 4,515 | 2.2% | September 2024–November 2024: Unavailable / Unavailable (Unavailable) | — |
| December 2025–February 2026 | 102 / 4,949 | 2.1% | December 2024–February 2025: Unavailable / Unavailable (Unavailable) | — |
| March 2026–May 2026 | 146 / 5,365 | 2.7% | March 2025–May 2025: Unavailable / Unavailable (Unavailable) | — |
| June 2026–August 2026 | 129 / 4,987 | 2.6% | June 2025–August 2025: 106 / 4,855 (2.2%) | +0.4 pp |
| September 2026 | 52 / 1,777 | 2.9% | September 2025: 34 / 1,560 (2.2%) | +0.7 pp |
Other headachesView figures and history 2.3% 1.8% 2.3%1.5% last year
Other headaches
Other headache concerns.
41 of 1,777 qualifying appointments addressed this concern.
Trailing 12 months: 363 appointments (1.8%) of 20,033.
Exact monthly figures — all saved history
| Month | Topic appointments | Qualifying appointments | Share |
|---|---|---|---|
| June 2025 | 19 | 1,787 | 1.1% |
| July 2025 | 26 | 1,617 | 1.6% |
| August 2025 | 25 | 1,451 | 1.7% |
| September 2025 | 23 | 1,560 | 1.5% |
| October 2025 | 26 | 1,450 | 1.8% |
| November 2025 | 27 | 1,505 | 1.8% |
| December 2025 | 26 | 1,603 | 1.6% |
| January 2026 | 32 | 1,739 | 1.8% |
| February 2026 | 25 | 1,607 | 1.6% |
| March 2026 | 27 | 1,843 | 1.5% |
| April 2026 | 34 | 1,725 | 2.0% |
| May 2026 | 40 | 1,797 | 2.2% |
| June 2026 | 22 | 1,697 | 1.3% |
| July 2026 | 30 | 1,733 | 1.7% |
| August 2026 | 33 | 1,557 | 2.1% |
| September 2026 | 41 | 1,777 | 2.3% |
Seasonal comparisons — matched periods
| Period | Appointments / qualifying | Share | Last year | Change |
|---|---|---|---|---|
| June 2025–August 2025 | 70 / 4,855 | 1.4% | June 2024–August 2024: Unavailable / Unavailable (Unavailable) | — |
| September 2025–November 2025 | 76 / 4,515 | 1.7% | September 2024–November 2024: Unavailable / Unavailable (Unavailable) | — |
| December 2025–February 2026 | 83 / 4,949 | 1.7% | December 2024–February 2025: Unavailable / Unavailable (Unavailable) | — |
| March 2026–May 2026 | 101 / 5,365 | 1.9% | March 2025–May 2025: Unavailable / Unavailable (Unavailable) | — |
| June 2026–August 2026 | 85 / 4,987 | 1.7% | June 2025–August 2025: 70 / 4,855 (1.4%) | +0.3 pp |
| September 2026 | 41 / 1,777 | 2.3% | September 2025: 23 / 1,560 (1.5%) | +0.8 pp |
Numbness, tingling & nerve concernsView figures and history 1.6% 1.5% 1.6%1.0% last year
Numbness, tingling & nerve concerns
Numbness, tingling or nerve-related concerns discussed or assessed.
29 of 1,777 qualifying appointments addressed this concern.
Trailing 12 months: 305 appointments (1.5%) of 20,033.
Exact monthly figures — all saved history
| Month | Topic appointments | Qualifying appointments | Share |
|---|---|---|---|
| June 2025 | 26 | 1,787 | 1.5% |
| July 2025 | 24 | 1,617 | 1.5% |
| August 2025 | 18 | 1,451 | 1.2% |
| September 2025 | 15 | 1,560 | 1.0% |
| October 2025 | 27 | 1,450 | 1.9% |
| November 2025 | 16 | 1,505 | 1.1% |
| December 2025 | 14 | 1,603 | 0.9% |
| January 2026 | 35 | 1,739 | 2.0% |
| February 2026 | 33 | 1,607 | 2.1% |
| March 2026 | 32 | 1,843 | 1.7% |
| April 2026 | 20 | 1,725 | 1.2% |
| May 2026 | 28 | 1,797 | 1.6% |
| June 2026 | 27 | 1,697 | 1.6% |
| July 2026 | 21 | 1,733 | 1.2% |
| August 2026 | 23 | 1,557 | 1.5% |
| September 2026 | 29 | 1,777 | 1.6% |
Seasonal comparisons — matched periods
| Period | Appointments / qualifying | Share | Last year | Change |
|---|---|---|---|---|
| June 2025–August 2025 | 68 / 4,855 | 1.4% | June 2024–August 2024: Unavailable / Unavailable (Unavailable) | — |
| September 2025–November 2025 | 58 / 4,515 | 1.3% | September 2024–November 2024: Unavailable / Unavailable (Unavailable) | — |
| December 2025–February 2026 | 82 / 4,949 | 1.7% | December 2024–February 2025: Unavailable / Unavailable (Unavailable) | — |
| March 2026–May 2026 | 80 / 5,365 | 1.5% | March 2025–May 2025: Unavailable / Unavailable (Unavailable) | — |
| June 2026–August 2026 | 71 / 4,987 | 1.4% | June 2025–August 2025: 68 / 4,855 (1.4%) | 0.0 pp |
| September 2026 | 29 / 1,777 | 1.6% | September 2025: 15 / 1,560 (1.0%) | +0.7 pp |
Other neurological concernsView figures and history 1.2% 1.1% 1.2%1.7% last year
Other neurological concerns
Other neurological concerns without a more specific recorded category.
21 of 1,777 qualifying appointments addressed this concern.
Trailing 12 months: 214 appointments (1.1%) of 20,033.
Exact monthly figures — all saved history
| Month | Topic appointments | Qualifying appointments | Share |
|---|---|---|---|
| June 2025 | 15 | 1,787 | 0.8% |
| July 2025 | 12 | 1,617 | 0.7% |
| August 2025 | 15 | 1,451 | 1.0% |
| September 2025 | 26 | 1,560 | 1.7% |
| October 2025 | 13 | 1,450 | 0.9% |
| November 2025 | 6 | 1,505 | 0.4% |
| December 2025 | 23 | 1,603 | 1.4% |
| January 2026 | 14 | 1,739 | 0.8% |
| February 2026 | 16 | 1,607 | 1.0% |
| March 2026 | 21 | 1,843 | 1.1% |
| April 2026 | 19 | 1,725 | 1.1% |
| May 2026 | 25 | 1,797 | 1.4% |
| June 2026 | 20 | 1,697 | 1.2% |
| July 2026 | 21 | 1,733 | 1.2% |
| August 2026 | 15 | 1,557 | 1.0% |
| September 2026 | 21 | 1,777 | 1.2% |
Seasonal comparisons — matched periods
| Period | Appointments / qualifying | Share | Last year | Change |
|---|---|---|---|---|
| June 2025–August 2025 | 42 / 4,855 | 0.9% | June 2024–August 2024: Unavailable / Unavailable (Unavailable) | — |
| September 2025–November 2025 | 45 / 4,515 | 1.0% | September 2024–November 2024: Unavailable / Unavailable (Unavailable) | — |
| December 2025–February 2026 | 53 / 4,949 | 1.1% | December 2024–February 2025: Unavailable / Unavailable (Unavailable) | — |
| March 2026–May 2026 | 65 / 5,365 | 1.2% | March 2025–May 2025: Unavailable / Unavailable (Unavailable) | — |
| June 2026–August 2026 | 56 / 4,987 | 1.1% | June 2025–August 2025: 42 / 4,855 (0.9%) | +0.3 pp |
| September 2026 | 21 / 1,777 | 1.2% | September 2025: 26 / 1,560 (1.7%) | -0.5 pp |
MigraineView figures and history 0.7% 0.8% 0.7%0.8% last year
Migraine
Migraine specifically discussed or assessed.
12 of 1,777 qualifying appointments addressed this concern.
Trailing 12 months: 164 appointments (0.8%) of 20,033.
Exact monthly figures — all saved history
| Month | Topic appointments | Qualifying appointments | Share |
|---|---|---|---|
| June 2025 | 8 | 1,787 | 0.4% |
| July 2025 | 6 | 1,617 | 0.4% |
| August 2025 | 17 | 1,451 | 1.2% |
| September 2025 | 13 | 1,560 | 0.8% |
| October 2025 | 15 | 1,450 | 1.0% |
| November 2025 | 14 | 1,505 | 0.9% |
| December 2025 | 12 | 1,603 | 0.7% |
| January 2026 | 12 | 1,739 | 0.7% |
| February 2026 | 13 | 1,607 | 0.8% |
| March 2026 | 17 | 1,843 | 0.9% |
| April 2026 | 15 | 1,725 | 0.9% |
| May 2026 | 16 | 1,797 | 0.9% |
| June 2026 | 9 | 1,697 | 0.5% |
| July 2026 | 12 | 1,733 | 0.7% |
| August 2026 | 17 | 1,557 | 1.1% |
| September 2026 | 12 | 1,777 | 0.7% |
Seasonal comparisons — matched periods
| Period | Appointments / qualifying | Share | Last year | Change |
|---|---|---|---|---|
| June 2025–August 2025 | 31 / 4,855 | 0.6% | June 2024–August 2024: Unavailable / Unavailable (Unavailable) | — |
| September 2025–November 2025 | 42 / 4,515 | 0.9% | September 2024–November 2024: Unavailable / Unavailable (Unavailable) | — |
| December 2025–February 2026 | 37 / 4,949 | 0.7% | December 2024–February 2025: Unavailable / Unavailable (Unavailable) | — |
| March 2026–May 2026 | 48 / 5,365 | 0.9% | March 2025–May 2025: Unavailable / Unavailable (Unavailable) | — |
| June 2026–August 2026 | 38 / 4,987 | 0.8% | June 2025–August 2025: 31 / 4,855 (0.6%) | +0.1 pp |
| September 2026 | 12 / 1,777 | 0.7% | September 2025: 13 / 1,560 (0.8%) | -0.2 pp |
View trends
Headaches & neurological
Headache, migraine, dizziness, balance, nerve and other neurological concerns.
141 of 1,777 qualifying appointments addressed this concern.
Trailing 12 months: 1,358 appointments (6.8%) of 20,033.
Exact monthly figures — all saved history
| Month | Topic appointments | Qualifying appointments | Share |
|---|---|---|---|
| June 2025 | 85 | 1,787 | 4.8% |
| July 2025 | 89 | 1,617 | 5.5% |
| August 2025 | 107 | 1,451 | 7.4% |
| September 2025 | 104 | 1,560 | 6.7% |
| October 2025 | 95 | 1,450 | 6.6% |
| November 2025 | 83 | 1,505 | 5.5% |
| December 2025 | 87 | 1,603 | 5.4% |
| January 2026 | 122 | 1,739 | 7.0% |
| February 2026 | 108 | 1,607 | 6.7% |
| March 2026 | 128 | 1,843 | 6.9% |
| April 2026 | 120 | 1,725 | 7.0% |
| May 2026 | 145 | 1,797 | 8.1% |
| June 2026 | 114 | 1,697 | 6.7% |
| July 2026 | 107 | 1,733 | 6.2% |
| August 2026 | 108 | 1,557 | 6.9% |
| September 2026 | 141 | 1,777 | 7.9% |
Seasonal comparisons — matched periods
| Period | Appointments / qualifying | Share | Last year | Change |
|---|---|---|---|---|
| June 2025–August 2025 | 281 / 4,855 | 5.8% | June 2024–August 2024: Unavailable / Unavailable (Unavailable) | — |
| September 2025–November 2025 | 282 / 4,515 | 6.2% | September 2024–November 2024: Unavailable / Unavailable (Unavailable) | — |
| December 2025–February 2026 | 317 / 4,949 | 6.4% | December 2024–February 2025: Unavailable / Unavailable (Unavailable) | — |
| March 2026–May 2026 | 393 / 5,365 | 7.3% | March 2025–May 2025: Unavailable / Unavailable (Unavailable) | — |
| June 2026–August 2026 | 329 / 4,987 | 6.6% | June 2025–August 2025: 281 / 4,855 (5.8%) | +0.8 pp |
| September 2026 | 141 / 1,777 | 7.9% | September 2025: 104 / 1,560 (6.7%) | +1.3 pp |
Women's & gynaecological healthShow 10 topics Hide topics 7.5% 7.5% 7.5%7.4% last year
Vaginal & vulval concernsShow 3 topics Hide topics 2.4% 2.1% 2.4%1.9% last year
Other vaginal/vulval concernsView figures and history 1.5% 1.3% 1.5%1.0% last year
Other vaginal/vulval concerns
Other vaginal or vulval symptoms and concerns.
26 of 1,777 qualifying appointments addressed this concern.
Trailing 12 months: 254 appointments (1.3%) of 20,033.
Exact monthly figures — all saved history
| Month | Topic appointments | Qualifying appointments | Share |
|---|---|---|---|
| June 2025 | 25 | 1,787 | 1.4% |
| July 2025 | 27 | 1,617 | 1.7% |
| August 2025 | 38 | 1,451 | 2.6% |
| September 2025 | 16 | 1,560 | 1.0% |
| October 2025 | 22 | 1,450 | 1.5% |
| November 2025 | 20 | 1,505 | 1.3% |
| December 2025 | 14 | 1,603 | 0.9% |
| January 2026 | 15 | 1,739 | 0.9% |
| February 2026 | 23 | 1,607 | 1.4% |
| March 2026 | 22 | 1,843 | 1.2% |
| April 2026 | 20 | 1,725 | 1.2% |
| May 2026 | 30 | 1,797 | 1.7% |
| June 2026 | 16 | 1,697 | 0.9% |
| July 2026 | 19 | 1,733 | 1.1% |
| August 2026 | 27 | 1,557 | 1.7% |
| September 2026 | 26 | 1,777 | 1.5% |
Seasonal comparisons — matched periods
| Period | Appointments / qualifying | Share | Last year | Change |
|---|---|---|---|---|
| June 2025–August 2025 | 90 / 4,855 | 1.9% | June 2024–August 2024: Unavailable / Unavailable (Unavailable) | — |
| September 2025–November 2025 | 58 / 4,515 | 1.3% | September 2024–November 2024: Unavailable / Unavailable (Unavailable) | — |
| December 2025–February 2026 | 52 / 4,949 | 1.1% | December 2024–February 2025: Unavailable / Unavailable (Unavailable) | — |
| March 2026–May 2026 | 72 / 5,365 | 1.3% | March 2025–May 2025: Unavailable / Unavailable (Unavailable) | — |
| June 2026–August 2026 | 62 / 4,987 | 1.2% | June 2025–August 2025: 90 / 4,855 (1.9%) | -0.6 pp |
| September 2026 | 26 / 1,777 | 1.5% | September 2025: 16 / 1,560 (1.0%) | +0.4 pp |
ThrushView figures and history 0.9% 0.8% 0.9%0.8% last year
Thrush
Vaginal or vulval thrush specifically discussed or assessed.
16 of 1,777 qualifying appointments addressed this concern.
Trailing 12 months: 152 appointments (0.8%) of 20,033.
Exact monthly figures — all saved history
| Month | Topic appointments | Qualifying appointments | Share |
|---|---|---|---|
| June 2025 | 9 | 1,787 | 0.5% |
| July 2025 | 23 | 1,617 | 1.4% |
| August 2025 | 13 | 1,451 | 0.9% |
| September 2025 | 12 | 1,560 | 0.8% |
| October 2025 | 26 | 1,450 | 1.8% |
| November 2025 | 15 | 1,505 | 1.0% |
| December 2025 | 10 | 1,603 | 0.6% |
| January 2026 | 10 | 1,739 | 0.6% |
| February 2026 | 10 | 1,607 | 0.6% |
| March 2026 | 10 | 1,843 | 0.5% |
| April 2026 | 8 | 1,725 | 0.5% |
| May 2026 | 9 | 1,797 | 0.5% |
| June 2026 | 11 | 1,697 | 0.6% |
| July 2026 | 14 | 1,733 | 0.8% |
| August 2026 | 13 | 1,557 | 0.8% |
| September 2026 | 16 | 1,777 | 0.9% |
Seasonal comparisons — matched periods
| Period | Appointments / qualifying | Share | Last year | Change |
|---|---|---|---|---|
| June 2025–August 2025 | 45 / 4,855 | 0.9% | June 2024–August 2024: Unavailable / Unavailable (Unavailable) | — |
| September 2025–November 2025 | 53 / 4,515 | 1.2% | September 2024–November 2024: Unavailable / Unavailable (Unavailable) | — |
| December 2025–February 2026 | 30 / 4,949 | 0.6% | December 2024–February 2025: Unavailable / Unavailable (Unavailable) | — |
| March 2026–May 2026 | 27 / 5,365 | 0.5% | March 2025–May 2025: Unavailable / Unavailable (Unavailable) | — |
| June 2026–August 2026 | 38 / 4,987 | 0.8% | June 2025–August 2025: 45 / 4,855 (0.9%) | -0.2 pp |
| September 2026 | 16 / 1,777 | 0.9% | September 2025: 12 / 1,560 (0.8%) | +0.1 pp |
Bacterial vaginosisView figures and history 0.2% 0.2% 0.2%0.1% last year
Bacterial vaginosis
Bacterial vaginosis specifically discussed or assessed.
4 of 1,777 qualifying appointments addressed this concern.
Trailing 12 months: 37 appointments (0.2%) of 20,033.
Exact monthly figures — all saved history
| Month | Topic appointments | Qualifying appointments | Share |
|---|---|---|---|
| June 2025 | 10 | 1,787 | 0.6% |
| July 2025 | 4 | 1,617 | 0.2% |
| August 2025 | 2 | 1,451 | 0.1% |
| September 2025 | 2 | 1,560 | 0.1% |
| October 2025 | 4 | 1,450 | 0.3% |
| November 2025 | 1 | 1,505 | 0.1% |
| December 2025 | 1 | 1,603 | 0.1% |
| January 2026 | 3 | 1,739 | 0.2% |
| February 2026 | 3 | 1,607 | 0.2% |
| March 2026 | 2 | 1,843 | 0.1% |
| April 2026 | 1 | 1,725 | 0.1% |
| May 2026 | 5 | 1,797 | 0.3% |
| June 2026 | 7 | 1,697 | 0.4% |
| July 2026 | 5 | 1,733 | 0.3% |
| August 2026 | 1 | 1,557 | 0.1% |
| September 2026 | 4 | 1,777 | 0.2% |
Seasonal comparisons — matched periods
| Period | Appointments / qualifying | Share | Last year | Change |
|---|---|---|---|---|
| June 2025–August 2025 | 16 / 4,855 | 0.3% | June 2024–August 2024: Unavailable / Unavailable (Unavailable) | — |
| September 2025–November 2025 | 7 / 4,515 | 0.2% | September 2024–November 2024: Unavailable / Unavailable (Unavailable) | — |
| December 2025–February 2026 | 7 / 4,949 | 0.1% | December 2024–February 2025: Unavailable / Unavailable (Unavailable) | — |
| March 2026–May 2026 | 8 / 5,365 | 0.1% | March 2025–May 2025: Unavailable / Unavailable (Unavailable) | — |
| June 2026–August 2026 | 13 / 4,987 | 0.3% | June 2025–August 2025: 16 / 4,855 (0.3%) | -0.1 pp |
| September 2026 | 4 / 1,777 | 0.2% | September 2025: 2 / 1,560 (0.1%) | +0.1 pp |
View trends
Vaginal & vulval concerns
Vaginal or vulval concerns, including thrush and bacterial vaginosis.
42 of 1,777 qualifying appointments addressed this concern.
Trailing 12 months: 423 appointments (2.1%) of 20,033.
Exact monthly figures — all saved history
| Month | Topic appointments | Qualifying appointments | Share |
|---|---|---|---|
| June 2025 | 43 | 1,787 | 2.4% |
| July 2025 | 51 | 1,617 | 3.2% |
| August 2025 | 51 | 1,451 | 3.5% |
| September 2025 | 29 | 1,560 | 1.9% |
| October 2025 | 50 | 1,450 | 3.4% |
| November 2025 | 34 | 1,505 | 2.3% |
| December 2025 | 25 | 1,603 | 1.6% |
| January 2026 | 27 | 1,739 | 1.6% |
| February 2026 | 34 | 1,607 | 2.1% |
| March 2026 | 34 | 1,843 | 1.8% |
| April 2026 | 28 | 1,725 | 1.6% |
| May 2026 | 41 | 1,797 | 2.3% |
| June 2026 | 33 | 1,697 | 1.9% |
| July 2026 | 37 | 1,733 | 2.1% |
| August 2026 | 38 | 1,557 | 2.4% |
| September 2026 | 42 | 1,777 | 2.4% |
Seasonal comparisons — matched periods
| Period | Appointments / qualifying | Share | Last year | Change |
|---|---|---|---|---|
| June 2025–August 2025 | 145 / 4,855 | 3.0% | June 2024–August 2024: Unavailable / Unavailable (Unavailable) | — |
| September 2025–November 2025 | 113 / 4,515 | 2.5% | September 2024–November 2024: Unavailable / Unavailable (Unavailable) | — |
| December 2025–February 2026 | 86 / 4,949 | 1.7% | December 2024–February 2025: Unavailable / Unavailable (Unavailable) | — |
| March 2026–May 2026 | 103 / 5,365 | 1.9% | March 2025–May 2025: Unavailable / Unavailable (Unavailable) | — |
| June 2026–August 2026 | 108 / 4,987 | 2.2% | June 2025–August 2025: 145 / 4,855 (3.0%) | -0.8 pp |
| September 2026 | 42 / 1,777 | 2.4% | September 2025: 29 / 1,560 (1.9%) | +0.5 pp |
Period & bleeding concernsShow 4 topics Hide topics 1.6% 1.9% 1.6%2.1% last year
Heavy bleedingView figures and history 0.6% 0.7% 0.6%0.6% last year
Heavy bleeding
Heavy menstrual bleeding specifically discussed or assessed.
10 of 1,777 qualifying appointments addressed this concern.
Trailing 12 months: 133 appointments (0.7%) of 20,033.
Exact monthly figures — all saved history
| Month | Topic appointments | Qualifying appointments | Share |
|---|---|---|---|
| June 2025 | 4 | 1,787 | 0.2% |
| July 2025 | 10 | 1,617 | 0.6% |
| August 2025 | 11 | 1,451 | 0.8% |
| September 2025 | 10 | 1,560 | 0.6% |
| October 2025 | 9 | 1,450 | 0.6% |
| November 2025 | 8 | 1,505 | 0.5% |
| December 2025 | 4 | 1,603 | 0.2% |
| January 2026 | 14 | 1,739 | 0.8% |
| February 2026 | 12 | 1,607 | 0.7% |
| March 2026 | 13 | 1,843 | 0.7% |
| April 2026 | 14 | 1,725 | 0.8% |
| May 2026 | 17 | 1,797 | 0.9% |
| June 2026 | 12 | 1,697 | 0.7% |
| July 2026 | 12 | 1,733 | 0.7% |
| August 2026 | 8 | 1,557 | 0.5% |
| September 2026 | 10 | 1,777 | 0.6% |
Seasonal comparisons — matched periods
| Period | Appointments / qualifying | Share | Last year | Change |
|---|---|---|---|---|
| June 2025–August 2025 | 25 / 4,855 | 0.5% | June 2024–August 2024: Unavailable / Unavailable (Unavailable) | — |
| September 2025–November 2025 | 27 / 4,515 | 0.6% | September 2024–November 2024: Unavailable / Unavailable (Unavailable) | — |
| December 2025–February 2026 | 30 / 4,949 | 0.6% | December 2024–February 2025: Unavailable / Unavailable (Unavailable) | — |
| March 2026–May 2026 | 44 / 5,365 | 0.8% | March 2025–May 2025: Unavailable / Unavailable (Unavailable) | — |
| June 2026–August 2026 | 32 / 4,987 | 0.6% | June 2025–August 2025: 25 / 4,855 (0.5%) | +0.1 pp |
| September 2026 | 10 / 1,777 | 0.6% | September 2025: 10 / 1,560 (0.6%) | -0.1 pp |
Other bleeding concernsView figures and history 0.6% 0.7% 0.6%0.7% last year
Other bleeding concerns
Other menstrual bleeding concerns.
10 of 1,777 qualifying appointments addressed this concern.
Trailing 12 months: 147 appointments (0.7%) of 20,033.
Exact monthly figures — all saved history
| Month | Topic appointments | Qualifying appointments | Share |
|---|---|---|---|
| June 2025 | 16 | 1,787 | 0.9% |
| July 2025 | 19 | 1,617 | 1.2% |
| August 2025 | 8 | 1,451 | 0.6% |
| September 2025 | 11 | 1,560 | 0.7% |
| October 2025 | 12 | 1,450 | 0.8% |
| November 2025 | 12 | 1,505 | 0.8% |
| December 2025 | 8 | 1,603 | 0.5% |
| January 2026 | 14 | 1,739 | 0.8% |
| February 2026 | 14 | 1,607 | 0.9% |
| March 2026 | 9 | 1,843 | 0.5% |
| April 2026 | 12 | 1,725 | 0.7% |
| May 2026 | 15 | 1,797 | 0.8% |
| June 2026 | 18 | 1,697 | 1.1% |
| July 2026 | 9 | 1,733 | 0.5% |
| August 2026 | 14 | 1,557 | 0.9% |
| September 2026 | 10 | 1,777 | 0.6% |
Seasonal comparisons — matched periods
| Period | Appointments / qualifying | Share | Last year | Change |
|---|---|---|---|---|
| June 2025–August 2025 | 43 / 4,855 | 0.9% | June 2024–August 2024: Unavailable / Unavailable (Unavailable) | — |
| September 2025–November 2025 | 35 / 4,515 | 0.8% | September 2024–November 2024: Unavailable / Unavailable (Unavailable) | — |
| December 2025–February 2026 | 36 / 4,949 | 0.7% | December 2024–February 2025: Unavailable / Unavailable (Unavailable) | — |
| March 2026–May 2026 | 36 / 5,365 | 0.7% | March 2025–May 2025: Unavailable / Unavailable (Unavailable) | — |
| June 2026–August 2026 | 41 / 4,987 | 0.8% | June 2025–August 2025: 43 / 4,855 (0.9%) | -0.1 pp |
| September 2026 | 10 / 1,777 | 0.6% | September 2025: 11 / 1,560 (0.7%) | -0.1 pp |
Irregular/absent periodsView figures and history 0.4% 0.6% 0.4%0.7% last year
Irregular/absent periods
Irregular or absent periods specifically discussed or assessed.
7 of 1,777 qualifying appointments addressed this concern.
Trailing 12 months: 112 appointments (0.6%) of 20,033.
Exact monthly figures — all saved history
| Month | Topic appointments | Qualifying appointments | Share |
|---|---|---|---|
| June 2025 | 13 | 1,787 | 0.7% |
| July 2025 | 11 | 1,617 | 0.7% |
| August 2025 | 8 | 1,451 | 0.6% |
| September 2025 | 11 | 1,560 | 0.7% |
| October 2025 | 11 | 1,450 | 0.8% |
| November 2025 | 11 | 1,505 | 0.7% |
| December 2025 | 3 | 1,603 | 0.2% |
| January 2026 | 9 | 1,739 | 0.5% |
| February 2026 | 15 | 1,607 | 0.9% |
| March 2026 | 11 | 1,843 | 0.6% |
| April 2026 | 7 | 1,725 | 0.4% |
| May 2026 | 13 | 1,797 | 0.7% |
| June 2026 | 13 | 1,697 | 0.8% |
| July 2026 | 8 | 1,733 | 0.5% |
| August 2026 | 4 | 1,557 | 0.3% |
| September 2026 | 7 | 1,777 | 0.4% |
Seasonal comparisons — matched periods
| Period | Appointments / qualifying | Share | Last year | Change |
|---|---|---|---|---|
| June 2025–August 2025 | 32 / 4,855 | 0.7% | June 2024–August 2024: Unavailable / Unavailable (Unavailable) | — |
| September 2025–November 2025 | 33 / 4,515 | 0.7% | September 2024–November 2024: Unavailable / Unavailable (Unavailable) | — |
| December 2025–February 2026 | 27 / 4,949 | 0.5% | December 2024–February 2025: Unavailable / Unavailable (Unavailable) | — |
| March 2026–May 2026 | 31 / 5,365 | 0.6% | March 2025–May 2025: Unavailable / Unavailable (Unavailable) | — |
| June 2026–August 2026 | 25 / 4,987 | 0.5% | June 2025–August 2025: 32 / 4,855 (0.7%) | -0.2 pp |
| September 2026 | 7 / 1,777 | 0.4% | September 2025: 11 / 1,560 (0.7%) | -0.3 pp |
Painful periodsView figures and history 0.3% 0.4% 0.3%0.4% last year
Painful periods
Painful periods specifically discussed or assessed.
5 of 1,777 qualifying appointments addressed this concern.
Trailing 12 months: 81 appointments (0.4%) of 20,033.
Exact monthly figures — all saved history
| Month | Topic appointments | Qualifying appointments | Share |
|---|---|---|---|
| June 2025 | 3 | 1,787 | 0.2% |
| July 2025 | 3 | 1,617 | 0.2% |
| August 2025 | 4 | 1,451 | 0.3% |
| September 2025 | 6 | 1,560 | 0.4% |
| October 2025 | 3 | 1,450 | 0.2% |
| November 2025 | 6 | 1,505 | 0.4% |
| December 2025 | 6 | 1,603 | 0.4% |
| January 2026 | 8 | 1,739 | 0.5% |
| February 2026 | 9 | 1,607 | 0.6% |
| March 2026 | 5 | 1,843 | 0.3% |
| April 2026 | 10 | 1,725 | 0.6% |
| May 2026 | 11 | 1,797 | 0.6% |
| June 2026 | 5 | 1,697 | 0.3% |
| July 2026 | 7 | 1,733 | 0.4% |
| August 2026 | 6 | 1,557 | 0.4% |
| September 2026 | 5 | 1,777 | 0.3% |
Seasonal comparisons — matched periods
| Period | Appointments / qualifying | Share | Last year | Change |
|---|---|---|---|---|
| June 2025–August 2025 | 10 / 4,855 | 0.2% | June 2024–August 2024: Unavailable / Unavailable (Unavailable) | — |
| September 2025–November 2025 | 15 / 4,515 | 0.3% | September 2024–November 2024: Unavailable / Unavailable (Unavailable) | — |
| December 2025–February 2026 | 23 / 4,949 | 0.5% | December 2024–February 2025: Unavailable / Unavailable (Unavailable) | — |
| March 2026–May 2026 | 26 / 5,365 | 0.5% | March 2025–May 2025: Unavailable / Unavailable (Unavailable) | — |
| June 2026–August 2026 | 18 / 4,987 | 0.4% | June 2025–August 2025: 10 / 4,855 (0.2%) | +0.2 pp |
| September 2026 | 5 / 1,777 | 0.3% | September 2025: 6 / 1,560 (0.4%) | -0.1 pp |
View trends
Period & bleeding concerns
Heavy, painful, irregular or absent periods and other menstrual bleeding concerns.
28 of 1,777 qualifying appointments addressed this concern.
Trailing 12 months: 390 appointments (1.9%) of 20,033.
Exact monthly figures — all saved history
| Month | Topic appointments | Qualifying appointments | Share |
|---|---|---|---|
| June 2025 | 33 | 1,787 | 1.8% |
| July 2025 | 37 | 1,617 | 2.3% |
| August 2025 | 27 | 1,451 | 1.9% |
| September 2025 | 32 | 1,560 | 2.1% |
| October 2025 | 28 | 1,450 | 1.9% |
| November 2025 | 33 | 1,505 | 2.2% |
| December 2025 | 18 | 1,603 | 1.1% |
| January 2026 | 32 | 1,739 | 1.8% |
| February 2026 | 40 | 1,607 | 2.5% |
| March 2026 | 33 | 1,843 | 1.8% |
| April 2026 | 37 | 1,725 | 2.1% |
| May 2026 | 45 | 1,797 | 2.5% |
| June 2026 | 38 | 1,697 | 2.2% |
| July 2026 | 29 | 1,733 | 1.7% |
| August 2026 | 29 | 1,557 | 1.9% |
| September 2026 | 28 | 1,777 | 1.6% |
Seasonal comparisons — matched periods
| Period | Appointments / qualifying | Share | Last year | Change |
|---|---|---|---|---|
| June 2025–August 2025 | 97 / 4,855 | 2.0% | June 2024–August 2024: Unavailable / Unavailable (Unavailable) | — |
| September 2025–November 2025 | 93 / 4,515 | 2.1% | September 2024–November 2024: Unavailable / Unavailable (Unavailable) | — |
| December 2025–February 2026 | 90 / 4,949 | 1.8% | December 2024–February 2025: Unavailable / Unavailable (Unavailable) | — |
| March 2026–May 2026 | 115 / 5,365 | 2.1% | March 2025–May 2025: Unavailable / Unavailable (Unavailable) | — |
| June 2026–August 2026 | 96 / 4,987 | 1.9% | June 2025–August 2025: 97 / 4,855 (2.0%) | -0.1 pp |
| September 2026 | 28 / 1,777 | 1.6% | September 2025: 32 / 1,560 (2.1%) | -0.5 pp |
Other pelvic & gynaecological concernsView figures and history 1.1% 1.0% 1.1%0.8% last year
Other pelvic & gynaecological concerns
Other pelvic or gynaecological concerns.
19 of 1,777 qualifying appointments addressed this concern.
Trailing 12 months: 206 appointments (1.0%) of 20,033.
Exact monthly figures — all saved history
| Month | Topic appointments | Qualifying appointments | Share |
|---|---|---|---|
| June 2025 | 12 | 1,787 | 0.7% |
| July 2025 | 18 | 1,617 | 1.1% |
| August 2025 | 8 | 1,451 | 0.6% |
| September 2025 | 12 | 1,560 | 0.8% |
| October 2025 | 6 | 1,450 | 0.4% |
| November 2025 | 14 | 1,505 | 0.9% |
| December 2025 | 12 | 1,603 | 0.7% |
| January 2026 | 18 | 1,739 | 1.0% |
| February 2026 | 19 | 1,607 | 1.2% |
| March 2026 | 26 | 1,843 | 1.4% |
| April 2026 | 24 | 1,725 | 1.4% |
| May 2026 | 23 | 1,797 | 1.3% |
| June 2026 | 21 | 1,697 | 1.2% |
| July 2026 | 10 | 1,733 | 0.6% |
| August 2026 | 14 | 1,557 | 0.9% |
| September 2026 | 19 | 1,777 | 1.1% |
Seasonal comparisons — matched periods
| Period | Appointments / qualifying | Share | Last year | Change |
|---|---|---|---|---|
| June 2025–August 2025 | 38 / 4,855 | 0.8% | June 2024–August 2024: Unavailable / Unavailable (Unavailable) | — |
| September 2025–November 2025 | 32 / 4,515 | 0.7% | September 2024–November 2024: Unavailable / Unavailable (Unavailable) | — |
| December 2025–February 2026 | 49 / 4,949 | 1.0% | December 2024–February 2025: Unavailable / Unavailable (Unavailable) | — |
| March 2026–May 2026 | 73 / 5,365 | 1.4% | March 2025–May 2025: Unavailable / Unavailable (Unavailable) | — |
| June 2026–August 2026 | 45 / 4,987 | 0.9% | June 2025–August 2025: 38 / 4,855 (0.8%) | +0.1 pp |
| September 2026 | 19 / 1,777 | 1.1% | September 2025: 12 / 1,560 (0.8%) | +0.3 pp |
Breast concernsShow 2 topics Hide topics 1.0% 0.9% 1.0%0.8% last year
Other breast concernsView figures and history 0.5% 0.5% 0.5%0.4% last year
Other breast concerns
Other breast symptoms or concerns, such as breast pain.
9 of 1,777 qualifying appointments addressed this concern.
Trailing 12 months: 94 appointments (0.5%) of 20,033.
Exact monthly figures — all saved history
| Month | Topic appointments | Qualifying appointments | Share |
|---|---|---|---|
| June 2025 | 10 | 1,787 | 0.6% |
| July 2025 | 4 | 1,617 | 0.2% |
| August 2025 | 6 | 1,451 | 0.4% |
| September 2025 | 7 | 1,560 | 0.4% |
| October 2025 | 9 | 1,450 | 0.6% |
| November 2025 | 10 | 1,505 | 0.7% |
| December 2025 | 14 | 1,603 | 0.9% |
| January 2026 | 5 | 1,739 | 0.3% |
| February 2026 | 4 | 1,607 | 0.2% |
| March 2026 | 8 | 1,843 | 0.4% |
| April 2026 | 5 | 1,725 | 0.3% |
| May 2026 | 11 | 1,797 | 0.6% |
| June 2026 | 5 | 1,697 | 0.3% |
| July 2026 | 6 | 1,733 | 0.3% |
| August 2026 | 8 | 1,557 | 0.5% |
| September 2026 | 9 | 1,777 | 0.5% |
Seasonal comparisons — matched periods
| Period | Appointments / qualifying | Share | Last year | Change |
|---|---|---|---|---|
| June 2025–August 2025 | 20 / 4,855 | 0.4% | June 2024–August 2024: Unavailable / Unavailable (Unavailable) | — |
| September 2025–November 2025 | 26 / 4,515 | 0.6% | September 2024–November 2024: Unavailable / Unavailable (Unavailable) | — |
| December 2025–February 2026 | 23 / 4,949 | 0.5% | December 2024–February 2025: Unavailable / Unavailable (Unavailable) | — |
| March 2026–May 2026 | 24 / 5,365 | 0.4% | March 2025–May 2025: Unavailable / Unavailable (Unavailable) | — |
| June 2026–August 2026 | 19 / 4,987 | 0.4% | June 2025–August 2025: 20 / 4,855 (0.4%) | 0.0 pp |
| September 2026 | 9 / 1,777 | 0.5% | September 2025: 7 / 1,560 (0.4%) | +0.1 pp |
Breast lumpView figures and history 0.5% 0.5% 0.5%0.3% last year
Breast lump
A breast lump specifically discussed or assessed. This category does not establish a cancer diagnosis.
8 of 1,777 qualifying appointments addressed this concern.
Trailing 12 months: 94 appointments (0.5%) of 20,033.
Exact monthly figures — all saved history
| Month | Topic appointments | Qualifying appointments | Share |
|---|---|---|---|
| June 2025 | 7 | 1,787 | 0.4% |
| July 2025 | 8 | 1,617 | 0.5% |
| August 2025 | 12 | 1,451 | 0.8% |
| September 2025 | 5 | 1,560 | 0.3% |
| October 2025 | 6 | 1,450 | 0.4% |
| November 2025 | 10 | 1,505 | 0.7% |
| December 2025 | 11 | 1,603 | 0.7% |
| January 2026 | 7 | 1,739 | 0.4% |
| February 2026 | 4 | 1,607 | 0.2% |
| March 2026 | 6 | 1,843 | 0.3% |
| April 2026 | 8 | 1,725 | 0.5% |
| May 2026 | 9 | 1,797 | 0.5% |
| June 2026 | 8 | 1,697 | 0.5% |
| July 2026 | 10 | 1,733 | 0.6% |
| August 2026 | 7 | 1,557 | 0.4% |
| September 2026 | 8 | 1,777 | 0.5% |
Seasonal comparisons — matched periods
| Period | Appointments / qualifying | Share | Last year | Change |
|---|---|---|---|---|
| June 2025–August 2025 | 27 / 4,855 | 0.6% | June 2024–August 2024: Unavailable / Unavailable (Unavailable) | — |
| September 2025–November 2025 | 21 / 4,515 | 0.5% | September 2024–November 2024: Unavailable / Unavailable (Unavailable) | — |
| December 2025–February 2026 | 22 / 4,949 | 0.4% | December 2024–February 2025: Unavailable / Unavailable (Unavailable) | — |
| March 2026–May 2026 | 23 / 5,365 | 0.4% | March 2025–May 2025: Unavailable / Unavailable (Unavailable) | — |
| June 2026–August 2026 | 25 / 4,987 | 0.5% | June 2025–August 2025: 27 / 4,855 (0.6%) | -0.1 pp |
| September 2026 | 8 / 1,777 | 0.5% | September 2025: 5 / 1,560 (0.3%) | +0.1 pp |
View trends
Breast concerns
Breast lumps, pain and other breast concerns assessed at the appointment.
17 of 1,777 qualifying appointments addressed this concern.
Trailing 12 months: 184 appointments (0.9%) of 20,033.
Exact monthly figures — all saved history
| Month | Topic appointments | Qualifying appointments | Share |
|---|---|---|---|
| June 2025 | 17 | 1,787 | 1.0% |
| July 2025 | 12 | 1,617 | 0.7% |
| August 2025 | 18 | 1,451 | 1.2% |
| September 2025 | 12 | 1,560 | 0.8% |
| October 2025 | 15 | 1,450 | 1.0% |
| November 2025 | 20 | 1,505 | 1.3% |
| December 2025 | 24 | 1,603 | 1.5% |
| January 2026 | 10 | 1,739 | 0.6% |
| February 2026 | 8 | 1,607 | 0.5% |
| March 2026 | 14 | 1,843 | 0.8% |
| April 2026 | 13 | 1,725 | 0.8% |
| May 2026 | 20 | 1,797 | 1.1% |
| June 2026 | 12 | 1,697 | 0.7% |
| July 2026 | 16 | 1,733 | 0.9% |
| August 2026 | 15 | 1,557 | 1.0% |
| September 2026 | 17 | 1,777 | 1.0% |
Seasonal comparisons — matched periods
| Period | Appointments / qualifying | Share | Last year | Change |
|---|---|---|---|---|
| June 2025–August 2025 | 47 / 4,855 | 1.0% | June 2024–August 2024: Unavailable / Unavailable (Unavailable) | — |
| September 2025–November 2025 | 47 / 4,515 | 1.0% | September 2024–November 2024: Unavailable / Unavailable (Unavailable) | — |
| December 2025–February 2026 | 42 / 4,949 | 0.8% | December 2024–February 2025: Unavailable / Unavailable (Unavailable) | — |
| March 2026–May 2026 | 47 / 5,365 | 0.9% | March 2025–May 2025: Unavailable / Unavailable (Unavailable) | — |
| June 2026–August 2026 | 43 / 4,987 | 0.9% | June 2025–August 2025: 47 / 4,855 (1.0%) | -0.1 pp |
| September 2026 | 17 / 1,777 | 1.0% | September 2025: 12 / 1,560 (0.8%) | +0.2 pp |
Menopause & perimenopauseView figures and history 0.8% 0.6% 0.8%0.8% last year
Menopause & perimenopause
Menopause or perimenopause symptoms, treatment or review.
14 of 1,777 qualifying appointments addressed this concern.
Trailing 12 months: 130 appointments (0.6%) of 20,033.
Exact monthly figures — all saved history
| Month | Topic appointments | Qualifying appointments | Share |
|---|---|---|---|
| June 2025 | 13 | 1,787 | 0.7% |
| July 2025 | 6 | 1,617 | 0.4% |
| August 2025 | 4 | 1,451 | 0.3% |
| September 2025 | 12 | 1,560 | 0.8% |
| October 2025 | 10 | 1,450 | 0.7% |
| November 2025 | 11 | 1,505 | 0.7% |
| December 2025 | 9 | 1,603 | 0.6% |
| January 2026 | 10 | 1,739 | 0.6% |
| February 2026 | 15 | 1,607 | 0.9% |
| March 2026 | 11 | 1,843 | 0.6% |
| April 2026 | 11 | 1,725 | 0.6% |
| May 2026 | 15 | 1,797 | 0.8% |
| June 2026 | 12 | 1,697 | 0.7% |
| July 2026 | 6 | 1,733 | 0.3% |
| August 2026 | 6 | 1,557 | 0.4% |
| September 2026 | 14 | 1,777 | 0.8% |
Seasonal comparisons — matched periods
| Period | Appointments / qualifying | Share | Last year | Change |
|---|---|---|---|---|
| June 2025–August 2025 | 23 / 4,855 | 0.5% | June 2024–August 2024: Unavailable / Unavailable (Unavailable) | — |
| September 2025–November 2025 | 33 / 4,515 | 0.7% | September 2024–November 2024: Unavailable / Unavailable (Unavailable) | — |
| December 2025–February 2026 | 34 / 4,949 | 0.7% | December 2024–February 2025: Unavailable / Unavailable (Unavailable) | — |
| March 2026–May 2026 | 37 / 5,365 | 0.7% | March 2025–May 2025: Unavailable / Unavailable (Unavailable) | — |
| June 2026–August 2026 | 24 / 4,987 | 0.5% | June 2025–August 2025: 23 / 4,855 (0.5%) | 0.0 pp |
| September 2026 | 14 / 1,777 | 0.8% | September 2025: 12 / 1,560 (0.8%) | 0.0 pp |
FertilityView figures and history 0.7% 0.3% 0.7%0.5% last year
Fertility
Fertility concerns discussed or assessed.
12 of 1,777 qualifying appointments addressed this concern.
Trailing 12 months: 66 appointments (0.3%) of 20,033.
Exact monthly figures — all saved history
| Month | Topic appointments | Qualifying appointments | Share |
|---|---|---|---|
| June 2025 | 9 | 1,787 | 0.5% |
| July 2025 | 9 | 1,617 | 0.6% |
| August 2025 | 4 | 1,451 | 0.3% |
| September 2025 | 8 | 1,560 | 0.5% |
| October 2025 | 4 | 1,450 | 0.3% |
| November 2025 | 4 | 1,505 | 0.3% |
| December 2025 | 5 | 1,603 | 0.3% |
| January 2026 | 7 | 1,739 | 0.4% |
| February 2026 | 3 | 1,607 | 0.2% |
| March 2026 | 7 | 1,843 | 0.4% |
| April 2026 | 6 | 1,725 | 0.3% |
| May 2026 | 4 | 1,797 | 0.2% |
| June 2026 | 6 | 1,697 | 0.4% |
| July 2026 | 4 | 1,733 | 0.2% |
| August 2026 | 4 | 1,557 | 0.3% |
| September 2026 | 12 | 1,777 | 0.7% |
Seasonal comparisons — matched periods
| Period | Appointments / qualifying | Share | Last year | Change |
|---|---|---|---|---|
| June 2025–August 2025 | 22 / 4,855 | 0.5% | June 2024–August 2024: Unavailable / Unavailable (Unavailable) | — |
| September 2025–November 2025 | 16 / 4,515 | 0.4% | September 2024–November 2024: Unavailable / Unavailable (Unavailable) | — |
| December 2025–February 2026 | 15 / 4,949 | 0.3% | December 2024–February 2025: Unavailable / Unavailable (Unavailable) | — |
| March 2026–May 2026 | 17 / 5,365 | 0.3% | March 2025–May 2025: Unavailable / Unavailable (Unavailable) | — |
| June 2026–August 2026 | 14 / 4,987 | 0.3% | June 2025–August 2025: 22 / 4,855 (0.5%) | -0.2 pp |
| September 2026 | 12 / 1,777 | 0.7% | September 2025: 8 / 1,560 (0.5%) | +0.2 pp |
Pregnancy & postnatal concernsView figures and history 0.6% 0.8% 0.6%0.8% last year
Pregnancy & postnatal concerns
Pregnancy-related or postnatal concerns addressed at the appointment.
11 of 1,777 qualifying appointments addressed this concern.
Trailing 12 months: 168 appointments (0.8%) of 20,033.
Exact monthly figures — all saved history
| Month | Topic appointments | Qualifying appointments | Share |
|---|---|---|---|
| June 2025 | 15 | 1,787 | 0.8% |
| July 2025 | 16 | 1,617 | 1.0% |
| August 2025 | 13 | 1,451 | 0.9% |
| September 2025 | 12 | 1,560 | 0.8% |
| October 2025 | 18 | 1,450 | 1.2% |
| November 2025 | 13 | 1,505 | 0.9% |
| December 2025 | 11 | 1,603 | 0.7% |
| January 2026 | 15 | 1,739 | 0.9% |
| February 2026 | 12 | 1,607 | 0.7% |
| March 2026 | 15 | 1,843 | 0.8% |
| April 2026 | 24 | 1,725 | 1.4% |
| May 2026 | 14 | 1,797 | 0.8% |
| June 2026 | 11 | 1,697 | 0.6% |
| July 2026 | 11 | 1,733 | 0.6% |
| August 2026 | 13 | 1,557 | 0.8% |
| September 2026 | 11 | 1,777 | 0.6% |
Seasonal comparisons — matched periods
| Period | Appointments / qualifying | Share | Last year | Change |
|---|---|---|---|---|
| June 2025–August 2025 | 44 / 4,855 | 0.9% | June 2024–August 2024: Unavailable / Unavailable (Unavailable) | — |
| September 2025–November 2025 | 43 / 4,515 | 1.0% | September 2024–November 2024: Unavailable / Unavailable (Unavailable) | — |
| December 2025–February 2026 | 38 / 4,949 | 0.8% | December 2024–February 2025: Unavailable / Unavailable (Unavailable) | — |
| March 2026–May 2026 | 53 / 5,365 | 1.0% | March 2025–May 2025: Unavailable / Unavailable (Unavailable) | — |
| June 2026–August 2026 | 35 / 4,987 | 0.7% | June 2025–August 2025: 44 / 4,855 (0.9%) | -0.2 pp |
| September 2026 | 11 / 1,777 | 0.6% | September 2025: 12 / 1,560 (0.8%) | -0.2 pp |
PCOSView figures and history 0.3% 0.3% 0.3%0.5% last year
PCOS
Polycystic ovary syndrome (PCOS) specifically discussed or assessed.
6 of 1,777 qualifying appointments addressed this concern.
Trailing 12 months: 70 appointments (0.3%) of 20,033.
Exact monthly figures — all saved history
| Month | Topic appointments | Qualifying appointments | Share |
|---|---|---|---|
| June 2025 | 9 | 1,787 | 0.5% |
| July 2025 | 6 | 1,617 | 0.4% |
| August 2025 | 8 | 1,451 | 0.6% |
| September 2025 | 8 | 1,560 | 0.5% |
| October 2025 | 7 | 1,450 | 0.5% |
| November 2025 | 7 | 1,505 | 0.5% |
| December 2025 | 4 | 1,603 | 0.2% |
| January 2026 | 3 | 1,739 | 0.2% |
| February 2026 | 2 | 1,607 | 0.1% |
| March 2026 | 12 | 1,843 | 0.7% |
| April 2026 | 10 | 1,725 | 0.6% |
| May 2026 | 5 | 1,797 | 0.3% |
| June 2026 | 5 | 1,697 | 0.3% |
| July 2026 | 4 | 1,733 | 0.2% |
| August 2026 | 5 | 1,557 | 0.3% |
| September 2026 | 6 | 1,777 | 0.3% |
Seasonal comparisons — matched periods
| Period | Appointments / qualifying | Share | Last year | Change |
|---|---|---|---|---|
| June 2025–August 2025 | 23 / 4,855 | 0.5% | June 2024–August 2024: Unavailable / Unavailable (Unavailable) | — |
| September 2025–November 2025 | 22 / 4,515 | 0.5% | September 2024–November 2024: Unavailable / Unavailable (Unavailable) | — |
| December 2025–February 2026 | 9 / 4,949 | 0.2% | December 2024–February 2025: Unavailable / Unavailable (Unavailable) | — |
| March 2026–May 2026 | 27 / 5,365 | 0.5% | March 2025–May 2025: Unavailable / Unavailable (Unavailable) | — |
| June 2026–August 2026 | 14 / 4,987 | 0.3% | June 2025–August 2025: 23 / 4,855 (0.5%) | -0.2 pp |
| September 2026 | 6 / 1,777 | 0.3% | September 2025: 8 / 1,560 (0.5%) | -0.2 pp |
ContraceptionView figures and history 0.3% 0.6% 0.3%0.5% last year
Contraception
Contraceptive advice, prescribing or review.
6 of 1,777 qualifying appointments addressed this concern.
Trailing 12 months: 118 appointments (0.6%) of 20,033.
Exact monthly figures — all saved history
| Month | Topic appointments | Qualifying appointments | Share |
|---|---|---|---|
| June 2025 | 10 | 1,787 | 0.6% |
| July 2025 | 16 | 1,617 | 1.0% |
| August 2025 | 11 | 1,451 | 0.8% |
| September 2025 | 8 | 1,560 | 0.5% |
| October 2025 | 12 | 1,450 | 0.8% |
| November 2025 | 14 | 1,505 | 0.9% |
| December 2025 | 8 | 1,603 | 0.5% |
| January 2026 | 10 | 1,739 | 0.6% |
| February 2026 | 9 | 1,607 | 0.6% |
| March 2026 | 10 | 1,843 | 0.5% |
| April 2026 | 8 | 1,725 | 0.5% |
| May 2026 | 7 | 1,797 | 0.4% |
| June 2026 | 13 | 1,697 | 0.8% |
| July 2026 | 12 | 1,733 | 0.7% |
| August 2026 | 9 | 1,557 | 0.6% |
| September 2026 | 6 | 1,777 | 0.3% |
Seasonal comparisons — matched periods
| Period | Appointments / qualifying | Share | Last year | Change |
|---|---|---|---|---|
| June 2025–August 2025 | 37 / 4,855 | 0.8% | June 2024–August 2024: Unavailable / Unavailable (Unavailable) | — |
| September 2025–November 2025 | 34 / 4,515 | 0.8% | September 2024–November 2024: Unavailable / Unavailable (Unavailable) | — |
| December 2025–February 2026 | 27 / 4,949 | 0.5% | December 2024–February 2025: Unavailable / Unavailable (Unavailable) | — |
| March 2026–May 2026 | 25 / 5,365 | 0.5% | March 2025–May 2025: Unavailable / Unavailable (Unavailable) | — |
| June 2026–August 2026 | 34 / 4,987 | 0.7% | June 2025–August 2025: 37 / 4,855 (0.8%) | -0.1 pp |
| September 2026 | 6 / 1,777 | 0.3% | September 2025: 8 / 1,560 (0.5%) | -0.2 pp |
EndometriosisView figures and history 0.2% 0.2% 0.2%0.2% last year
Endometriosis
Endometriosis specifically discussed or assessed.
3 of 1,777 qualifying appointments addressed this concern.
Trailing 12 months: 33 appointments (0.2%) of 20,033.
Exact monthly figures — all saved history
| Month | Topic appointments | Qualifying appointments | Share |
|---|---|---|---|
| June 2025 | 2 | 1,787 | 0.1% |
| July 2025 | 3 | 1,617 | 0.2% |
| August 2025 | 2 | 1,451 | 0.1% |
| September 2025 | 3 | 1,560 | 0.2% |
| October 2025 | 2 | 1,450 | 0.1% |
| November 2025 | 2 | 1,505 | 0.1% |
| December 2025 | 1 | 1,603 | 0.1% |
| January 2026 | 5 | 1,739 | 0.3% |
| February 2026 | 3 | 1,607 | 0.2% |
| March 2026 | 1 | 1,843 | 0.1% |
| April 2026 | 2 | 1,725 | 0.1% |
| May 2026 | 2 | 1,797 | 0.1% |
| June 2026 | 4 | 1,697 | 0.2% |
| July 2026 | 5 | 1,733 | 0.3% |
| August 2026 | 3 | 1,557 | 0.2% |
| September 2026 | 3 | 1,777 | 0.2% |
Seasonal comparisons — matched periods
| Period | Appointments / qualifying | Share | Last year | Change |
|---|---|---|---|---|
| June 2025–August 2025 | 7 / 4,855 | 0.1% | June 2024–August 2024: Unavailable / Unavailable (Unavailable) | — |
| September 2025–November 2025 | 7 / 4,515 | 0.2% | September 2024–November 2024: Unavailable / Unavailable (Unavailable) | — |
| December 2025–February 2026 | 9 / 4,949 | 0.2% | December 2024–February 2025: Unavailable / Unavailable (Unavailable) | — |
| March 2026–May 2026 | 5 / 5,365 | 0.1% | March 2025–May 2025: Unavailable / Unavailable (Unavailable) | — |
| June 2026–August 2026 | 12 / 4,987 | 0.2% | June 2025–August 2025: 7 / 4,855 (0.1%) | +0.1 pp |
| September 2026 | 3 / 1,777 | 0.2% | September 2025: 3 / 1,560 (0.2%) | 0.0 pp |
View trends
Women's & gynaecological health
Menstrual, menopause, contraceptive, pregnancy, fertility, breast and gynaecological concerns.
133 of 1,777 qualifying appointments addressed this concern.
Trailing 12 months: 1,494 appointments (7.5%) of 20,033.
Exact monthly figures — all saved history
| Month | Topic appointments | Qualifying appointments | Share |
|---|---|---|---|
| June 2025 | 141 | 1,787 | 7.9% |
| July 2025 | 150 | 1,617 | 9.3% |
| August 2025 | 124 | 1,451 | 8.5% |
| September 2025 | 115 | 1,560 | 7.4% |
| October 2025 | 136 | 1,450 | 9.4% |
| November 2025 | 123 | 1,505 | 8.2% |
| December 2025 | 93 | 1,603 | 5.8% |
| January 2026 | 116 | 1,739 | 6.7% |
| February 2026 | 130 | 1,607 | 8.1% |
| March 2026 | 134 | 1,843 | 7.3% |
| April 2026 | 132 | 1,725 | 7.7% |
| May 2026 | 146 | 1,797 | 8.1% |
| June 2026 | 120 | 1,697 | 7.1% |
| July 2026 | 117 | 1,733 | 6.8% |
| August 2026 | 114 | 1,557 | 7.3% |
| September 2026 | 133 | 1,777 | 7.5% |
Seasonal comparisons — matched periods
| Period | Appointments / qualifying | Share | Last year | Change |
|---|---|---|---|---|
| June 2025–August 2025 | 415 / 4,855 | 8.5% | June 2024–August 2024: Unavailable / Unavailable (Unavailable) | — |
| September 2025–November 2025 | 374 / 4,515 | 8.3% | September 2024–November 2024: Unavailable / Unavailable (Unavailable) | — |
| December 2025–February 2026 | 339 / 4,949 | 6.8% | December 2024–February 2025: Unavailable / Unavailable (Unavailable) | — |
| March 2026–May 2026 | 412 / 5,365 | 7.7% | March 2025–May 2025: Unavailable / Unavailable (Unavailable) | — |
| June 2026–August 2026 | 351 / 4,987 | 7.0% | June 2025–August 2025: 415 / 4,855 (8.5%) | -1.5 pp |
| September 2026 | 133 / 1,777 | 7.5% | September 2025: 115 / 1,560 (7.4%) | +0.1 pp |
Heart, blood pressure & circulationShow 6 topics Hide topics 6.6% 7.0% 6.6%6.9% last year
High blood pressureView figures and history 2.1% 2.7% 2.1%2.3% last year
High blood pressure
High blood pressure assessment, treatment or review.
38 of 1,777 qualifying appointments addressed this concern.
Trailing 12 months: 538 appointments (2.7%) of 20,033.
Exact monthly figures — all saved history
| Month | Topic appointments | Qualifying appointments | Share |
|---|---|---|---|
| June 2025 | 29 | 1,787 | 1.6% |
| July 2025 | 26 | 1,617 | 1.6% |
| August 2025 | 26 | 1,451 | 1.8% |
| September 2025 | 36 | 1,560 | 2.3% |
| October 2025 | 38 | 1,450 | 2.6% |
| November 2025 | 29 | 1,505 | 1.9% |
| December 2025 | 48 | 1,603 | 3.0% |
| January 2026 | 52 | 1,739 | 3.0% |
| February 2026 | 54 | 1,607 | 3.4% |
| March 2026 | 46 | 1,843 | 2.5% |
| April 2026 | 55 | 1,725 | 3.2% |
| May 2026 | 56 | 1,797 | 3.1% |
| June 2026 | 41 | 1,697 | 2.4% |
| July 2026 | 44 | 1,733 | 2.5% |
| August 2026 | 37 | 1,557 | 2.4% |
| September 2026 | 38 | 1,777 | 2.1% |
Seasonal comparisons — matched periods
| Period | Appointments / qualifying | Share | Last year | Change |
|---|---|---|---|---|
| June 2025–August 2025 | 81 / 4,855 | 1.7% | June 2024–August 2024: Unavailable / Unavailable (Unavailable) | — |
| September 2025–November 2025 | 103 / 4,515 | 2.3% | September 2024–November 2024: Unavailable / Unavailable (Unavailable) | — |
| December 2025–February 2026 | 154 / 4,949 | 3.1% | December 2024–February 2025: Unavailable / Unavailable (Unavailable) | — |
| March 2026–May 2026 | 157 / 5,365 | 2.9% | March 2025–May 2025: Unavailable / Unavailable (Unavailable) | — |
| June 2026–August 2026 | 122 / 4,987 | 2.4% | June 2025–August 2025: 81 / 4,855 (1.7%) | +0.8 pp |
| September 2026 | 38 / 1,777 | 2.1% | September 2025: 36 / 1,560 (2.3%) | -0.2 pp |
Chest painView figures and history 2.0% 1.6% 2.0%1.5% last year
Chest pain
Chest pain discussed or assessed. This category does not establish a heart disease diagnosis.
36 of 1,777 qualifying appointments addressed this concern.
Trailing 12 months: 328 appointments (1.6%) of 20,033.
Exact monthly figures — all saved history
| Month | Topic appointments | Qualifying appointments | Share |
|---|---|---|---|
| June 2025 | 20 | 1,787 | 1.1% |
| July 2025 | 19 | 1,617 | 1.2% |
| August 2025 | 17 | 1,451 | 1.2% |
| September 2025 | 23 | 1,560 | 1.5% |
| October 2025 | 19 | 1,450 | 1.3% |
| November 2025 | 21 | 1,505 | 1.4% |
| December 2025 | 20 | 1,603 | 1.2% |
| January 2026 | 37 | 1,739 | 2.1% |
| February 2026 | 30 | 1,607 | 1.9% |
| March 2026 | 28 | 1,843 | 1.5% |
| April 2026 | 25 | 1,725 | 1.4% |
| May 2026 | 45 | 1,797 | 2.5% |
| June 2026 | 23 | 1,697 | 1.4% |
| July 2026 | 27 | 1,733 | 1.6% |
| August 2026 | 17 | 1,557 | 1.1% |
| September 2026 | 36 | 1,777 | 2.0% |
Seasonal comparisons — matched periods
| Period | Appointments / qualifying | Share | Last year | Change |
|---|---|---|---|---|
| June 2025–August 2025 | 56 / 4,855 | 1.2% | June 2024–August 2024: Unavailable / Unavailable (Unavailable) | — |
| September 2025–November 2025 | 63 / 4,515 | 1.4% | September 2024–November 2024: Unavailable / Unavailable (Unavailable) | — |
| December 2025–February 2026 | 87 / 4,949 | 1.8% | December 2024–February 2025: Unavailable / Unavailable (Unavailable) | — |
| March 2026–May 2026 | 98 / 5,365 | 1.8% | March 2025–May 2025: Unavailable / Unavailable (Unavailable) | — |
| June 2026–August 2026 | 67 / 4,987 | 1.3% | June 2025–August 2025: 56 / 4,855 (1.2%) | +0.2 pp |
| September 2026 | 36 / 1,777 | 2.0% | September 2025: 23 / 1,560 (1.5%) | +0.6 pp |
Palpitations & rhythm concernsShow 2 topics Hide topics 1.5% 1.7% 1.5%1.4% last year
Palpitations without named diagnosisView figures and history 1.4% 1.5% 1.4%1.2% last year
Palpitations without named diagnosis
Palpitations assessed without a named heart rhythm diagnosis recorded for that concern.
24 of 1,777 qualifying appointments addressed this concern.
Trailing 12 months: 291 appointments (1.5%) of 20,033.
Exact monthly figures — all saved history
| Month | Topic appointments | Qualifying appointments | Share |
|---|---|---|---|
| June 2025 | 11 | 1,787 | 0.6% |
| July 2025 | 15 | 1,617 | 0.9% |
| August 2025 | 22 | 1,451 | 1.5% |
| September 2025 | 19 | 1,560 | 1.2% |
| October 2025 | 13 | 1,450 | 0.9% |
| November 2025 | 16 | 1,505 | 1.1% |
| December 2025 | 21 | 1,603 | 1.3% |
| January 2026 | 25 | 1,739 | 1.4% |
| February 2026 | 32 | 1,607 | 2.0% |
| March 2026 | 25 | 1,843 | 1.4% |
| April 2026 | 29 | 1,725 | 1.7% |
| May 2026 | 43 | 1,797 | 2.4% |
| June 2026 | 25 | 1,697 | 1.5% |
| July 2026 | 24 | 1,733 | 1.4% |
| August 2026 | 14 | 1,557 | 0.9% |
| September 2026 | 24 | 1,777 | 1.4% |
Seasonal comparisons — matched periods
| Period | Appointments / qualifying | Share | Last year | Change |
|---|---|---|---|---|
| June 2025–August 2025 | 48 / 4,855 | 1.0% | June 2024–August 2024: Unavailable / Unavailable (Unavailable) | — |
| September 2025–November 2025 | 48 / 4,515 | 1.1% | September 2024–November 2024: Unavailable / Unavailable (Unavailable) | — |
| December 2025–February 2026 | 78 / 4,949 | 1.6% | December 2024–February 2025: Unavailable / Unavailable (Unavailable) | — |
| March 2026–May 2026 | 97 / 5,365 | 1.8% | March 2025–May 2025: Unavailable / Unavailable (Unavailable) | — |
| June 2026–August 2026 | 63 / 4,987 | 1.3% | June 2025–August 2025: 48 / 4,855 (1.0%) | +0.3 pp |
| September 2026 | 24 / 1,777 | 1.4% | September 2025: 19 / 1,560 (1.2%) | +0.1 pp |
Known rhythm conditionsView figures and history 0.2% 0.2% 0.2%0.2% last year
Known rhythm conditions
Known heart rhythm conditions discussed or reviewed.
3 of 1,777 qualifying appointments addressed this concern.
Trailing 12 months: 42 appointments (0.2%) of 20,033.
Exact monthly figures — all saved history
| Month | Topic appointments | Qualifying appointments | Share |
|---|---|---|---|
| June 2025 | 4 | 1,787 | 0.2% |
| July 2025 | 5 | 1,617 | 0.3% |
| August 2025 | 1 | 1,451 | 0.1% |
| September 2025 | 3 | 1,560 | 0.2% |
| October 2025 | 3 | 1,450 | 0.2% |
| November 2025 | 5 | 1,505 | 0.3% |
| December 2025 | 3 | 1,603 | 0.2% |
| January 2026 | 5 | 1,739 | 0.3% |
| February 2026 | 7 | 1,607 | 0.4% |
| March 2026 | 0 | 1,843 | 0.0% |
| April 2026 | 3 | 1,725 | 0.2% |
| May 2026 | 3 | 1,797 | 0.2% |
| June 2026 | 4 | 1,697 | 0.2% |
| July 2026 | 3 | 1,733 | 0.2% |
| August 2026 | 3 | 1,557 | 0.2% |
| September 2026 | 3 | 1,777 | 0.2% |
Seasonal comparisons — matched periods
| Period | Appointments / qualifying | Share | Last year | Change |
|---|---|---|---|---|
| June 2025–August 2025 | 10 / 4,855 | 0.2% | June 2024–August 2024: Unavailable / Unavailable (Unavailable) | — |
| September 2025–November 2025 | 11 / 4,515 | 0.2% | September 2024–November 2024: Unavailable / Unavailable (Unavailable) | — |
| December 2025–February 2026 | 15 / 4,949 | 0.3% | December 2024–February 2025: Unavailable / Unavailable (Unavailable) | — |
| March 2026–May 2026 | 6 / 5,365 | 0.1% | March 2025–May 2025: Unavailable / Unavailable (Unavailable) | — |
| June 2026–August 2026 | 10 / 4,987 | 0.2% | June 2025–August 2025: 10 / 4,855 (0.2%) | 0.0 pp |
| September 2026 | 3 / 1,777 | 0.2% | September 2025: 3 / 1,560 (0.2%) | 0.0 pp |
View trends
Palpitations & rhythm concerns
Palpitations and known heart rhythm conditions assessed at the appointment.
27 of 1,777 qualifying appointments addressed this concern.
Trailing 12 months: 333 appointments (1.7%) of 20,033.
Exact monthly figures — all saved history
| Month | Topic appointments | Qualifying appointments | Share |
|---|---|---|---|
| June 2025 | 15 | 1,787 | 0.8% |
| July 2025 | 20 | 1,617 | 1.2% |
| August 2025 | 23 | 1,451 | 1.6% |
| September 2025 | 22 | 1,560 | 1.4% |
| October 2025 | 16 | 1,450 | 1.1% |
| November 2025 | 21 | 1,505 | 1.4% |
| December 2025 | 24 | 1,603 | 1.5% |
| January 2026 | 30 | 1,739 | 1.7% |
| February 2026 | 39 | 1,607 | 2.4% |
| March 2026 | 25 | 1,843 | 1.4% |
| April 2026 | 32 | 1,725 | 1.9% |
| May 2026 | 46 | 1,797 | 2.6% |
| June 2026 | 29 | 1,697 | 1.7% |
| July 2026 | 27 | 1,733 | 1.6% |
| August 2026 | 17 | 1,557 | 1.1% |
| September 2026 | 27 | 1,777 | 1.5% |
Seasonal comparisons — matched periods
| Period | Appointments / qualifying | Share | Last year | Change |
|---|---|---|---|---|
| June 2025–August 2025 | 58 / 4,855 | 1.2% | June 2024–August 2024: Unavailable / Unavailable (Unavailable) | — |
| September 2025–November 2025 | 59 / 4,515 | 1.3% | September 2024–November 2024: Unavailable / Unavailable (Unavailable) | — |
| December 2025–February 2026 | 93 / 4,949 | 1.9% | December 2024–February 2025: Unavailable / Unavailable (Unavailable) | — |
| March 2026–May 2026 | 103 / 5,365 | 1.9% | March 2025–May 2025: Unavailable / Unavailable (Unavailable) | — |
| June 2026–August 2026 | 73 / 4,987 | 1.5% | June 2025–August 2025: 58 / 4,855 (1.2%) | +0.3 pp |
| September 2026 | 27 / 1,777 | 1.5% | September 2025: 22 / 1,560 (1.4%) | +0.1 pp |
Circulation & leg swellingView figures and history 0.9% 0.7% 0.9%1.0% last year
Circulation & leg swelling
Circulation concerns or leg swelling discussed or assessed.
16 of 1,777 qualifying appointments addressed this concern.
Trailing 12 months: 150 appointments (0.7%) of 20,033.
Exact monthly figures — all saved history
| Month | Topic appointments | Qualifying appointments | Share |
|---|---|---|---|
| June 2025 | 13 | 1,787 | 0.7% |
| July 2025 | 7 | 1,617 | 0.4% |
| August 2025 | 9 | 1,451 | 0.6% |
| September 2025 | 15 | 1,560 | 1.0% |
| October 2025 | 11 | 1,450 | 0.8% |
| November 2025 | 2 | 1,505 | 0.1% |
| December 2025 | 7 | 1,603 | 0.4% |
| January 2026 | 11 | 1,739 | 0.6% |
| February 2026 | 12 | 1,607 | 0.7% |
| March 2026 | 12 | 1,843 | 0.7% |
| April 2026 | 14 | 1,725 | 0.8% |
| May 2026 | 17 | 1,797 | 0.9% |
| June 2026 | 16 | 1,697 | 0.9% |
| July 2026 | 14 | 1,733 | 0.8% |
| August 2026 | 18 | 1,557 | 1.2% |
| September 2026 | 16 | 1,777 | 0.9% |
Seasonal comparisons — matched periods
| Period | Appointments / qualifying | Share | Last year | Change |
|---|---|---|---|---|
| June 2025–August 2025 | 29 / 4,855 | 0.6% | June 2024–August 2024: Unavailable / Unavailable (Unavailable) | — |
| September 2025–November 2025 | 28 / 4,515 | 0.6% | September 2024–November 2024: Unavailable / Unavailable (Unavailable) | — |
| December 2025–February 2026 | 30 / 4,949 | 0.6% | December 2024–February 2025: Unavailable / Unavailable (Unavailable) | — |
| March 2026–May 2026 | 43 / 5,365 | 0.8% | March 2025–May 2025: Unavailable / Unavailable (Unavailable) | — |
| June 2026–August 2026 | 48 / 4,987 | 1.0% | June 2025–August 2025: 29 / 4,855 (0.6%) | +0.4 pp |
| September 2026 | 16 / 1,777 | 0.9% | September 2025: 15 / 1,560 (1.0%) | -0.1 pp |
CholesterolView figures and history 0.7% 1.2% 0.7%1.2% last year
Cholesterol
Cholesterol-related assessment, treatment or review.
13 of 1,777 qualifying appointments addressed this concern.
Trailing 12 months: 241 appointments (1.2%) of 20,033.
Exact monthly figures — all saved history
| Month | Topic appointments | Qualifying appointments | Share |
|---|---|---|---|
| June 2025 | 16 | 1,787 | 0.9% |
| July 2025 | 15 | 1,617 | 0.9% |
| August 2025 | 12 | 1,451 | 0.8% |
| September 2025 | 18 | 1,560 | 1.2% |
| October 2025 | 13 | 1,450 | 0.9% |
| November 2025 | 13 | 1,505 | 0.9% |
| December 2025 | 22 | 1,603 | 1.4% |
| January 2026 | 19 | 1,739 | 1.1% |
| February 2026 | 17 | 1,607 | 1.1% |
| March 2026 | 30 | 1,843 | 1.6% |
| April 2026 | 30 | 1,725 | 1.7% |
| May 2026 | 26 | 1,797 | 1.4% |
| June 2026 | 24 | 1,697 | 1.4% |
| July 2026 | 23 | 1,733 | 1.3% |
| August 2026 | 11 | 1,557 | 0.7% |
| September 2026 | 13 | 1,777 | 0.7% |
Seasonal comparisons — matched periods
| Period | Appointments / qualifying | Share | Last year | Change |
|---|---|---|---|---|
| June 2025–August 2025 | 43 / 4,855 | 0.9% | June 2024–August 2024: Unavailable / Unavailable (Unavailable) | — |
| September 2025–November 2025 | 44 / 4,515 | 1.0% | September 2024–November 2024: Unavailable / Unavailable (Unavailable) | — |
| December 2025–February 2026 | 58 / 4,949 | 1.2% | December 2024–February 2025: Unavailable / Unavailable (Unavailable) | — |
| March 2026–May 2026 | 86 / 5,365 | 1.6% | March 2025–May 2025: Unavailable / Unavailable (Unavailable) | — |
| June 2026–August 2026 | 58 / 4,987 | 1.2% | June 2025–August 2025: 43 / 4,855 (0.9%) | +0.3 pp |
| September 2026 | 13 / 1,777 | 0.7% | September 2025: 18 / 1,560 (1.2%) | -0.4 pp |
Other heart conditionsView figures and history 0.4% 0.3% 0.4%0.3% last year
Other heart conditions
Other heart conditions discussed or assessed.
7 of 1,777 qualifying appointments addressed this concern.
Trailing 12 months: 56 appointments (0.3%) of 20,033.
Exact monthly figures — all saved history
| Month | Topic appointments | Qualifying appointments | Share |
|---|---|---|---|
| June 2025 | 6 | 1,787 | 0.3% |
| July 2025 | 4 | 1,617 | 0.2% |
| August 2025 | 4 | 1,451 | 0.3% |
| September 2025 | 4 | 1,560 | 0.3% |
| October 2025 | 3 | 1,450 | 0.2% |
| November 2025 | 4 | 1,505 | 0.3% |
| December 2025 | 2 | 1,603 | 0.1% |
| January 2026 | 3 | 1,739 | 0.2% |
| February 2026 | 5 | 1,607 | 0.3% |
| March 2026 | 5 | 1,843 | 0.3% |
| April 2026 | 4 | 1,725 | 0.2% |
| May 2026 | 6 | 1,797 | 0.3% |
| June 2026 | 6 | 1,697 | 0.4% |
| July 2026 | 7 | 1,733 | 0.4% |
| August 2026 | 4 | 1,557 | 0.3% |
| September 2026 | 7 | 1,777 | 0.4% |
Seasonal comparisons — matched periods
| Period | Appointments / qualifying | Share | Last year | Change |
|---|---|---|---|---|
| June 2025–August 2025 | 14 / 4,855 | 0.3% | June 2024–August 2024: Unavailable / Unavailable (Unavailable) | — |
| September 2025–November 2025 | 11 / 4,515 | 0.2% | September 2024–November 2024: Unavailable / Unavailable (Unavailable) | — |
| December 2025–February 2026 | 10 / 4,949 | 0.2% | December 2024–February 2025: Unavailable / Unavailable (Unavailable) | — |
| March 2026–May 2026 | 15 / 5,365 | 0.3% | March 2025–May 2025: Unavailable / Unavailable (Unavailable) | — |
| June 2026–August 2026 | 17 / 4,987 | 0.3% | June 2025–August 2025: 14 / 4,855 (0.3%) | +0.1 pp |
| September 2026 | 7 / 1,777 | 0.4% | September 2025: 4 / 1,560 (0.3%) | +0.1 pp |
View trends
Heart, blood pressure & circulation
Heart, rhythm, blood pressure, cholesterol and circulation concerns.
117 of 1,777 qualifying appointments addressed this concern.
Trailing 12 months: 1,411 appointments (7.0%) of 20,033.
Exact monthly figures — all saved history
| Month | Topic appointments | Qualifying appointments | Share |
|---|---|---|---|
| June 2025 | 86 | 1,787 | 4.8% |
| July 2025 | 75 | 1,617 | 4.6% |
| August 2025 | 78 | 1,451 | 5.4% |
| September 2025 | 107 | 1,560 | 6.9% |
| October 2025 | 91 | 1,450 | 6.3% |
| November 2025 | 82 | 1,505 | 5.4% |
| December 2025 | 99 | 1,603 | 6.2% |
| January 2026 | 137 | 1,739 | 7.9% |
| February 2026 | 131 | 1,607 | 8.2% |
| March 2026 | 124 | 1,843 | 6.7% |
| April 2026 | 137 | 1,725 | 7.9% |
| May 2026 | 161 | 1,797 | 9.0% |
| June 2026 | 120 | 1,697 | 7.1% |
| July 2026 | 124 | 1,733 | 7.2% |
| August 2026 | 88 | 1,557 | 5.7% |
| September 2026 | 117 | 1,777 | 6.6% |
Seasonal comparisons — matched periods
| Period | Appointments / qualifying | Share | Last year | Change |
|---|---|---|---|---|
| June 2025–August 2025 | 239 / 4,855 | 4.9% | June 2024–August 2024: Unavailable / Unavailable (Unavailable) | — |
| September 2025–November 2025 | 280 / 4,515 | 6.2% | September 2024–November 2024: Unavailable / Unavailable (Unavailable) | — |
| December 2025–February 2026 | 367 / 4,949 | 7.4% | December 2024–February 2025: Unavailable / Unavailable (Unavailable) | — |
| March 2026–May 2026 | 422 / 5,365 | 7.9% | March 2025–May 2025: Unavailable / Unavailable (Unavailable) | — |
| June 2026–August 2026 | 332 / 4,987 | 6.7% | June 2025–August 2025: 239 / 4,855 (4.9%) | +1.7 pp |
| September 2026 | 117 / 1,777 | 6.6% | September 2025: 107 / 1,560 (6.9%) | -0.3 pp |
Urinary & kidneyShow 5 topics Hide topics 5.7% 5.7% 5.7%7.8% last year
Urinary tract infectionsShow 3 topics Hide topics 3.5% 3.4% 3.5%5.5% last year
Lower UTI/cystitisView figures and history 2.6% 2.6% 2.6%4.2% last year
Lower UTI/cystitis
Lower urinary tract infection or cystitis concerns, including suspected infection.
47 of 1,777 qualifying appointments addressed this concern.
Trailing 12 months: 513 appointments (2.6%) of 20,033.
Exact monthly figures — all saved history
| Month | Topic appointments | Qualifying appointments | Share |
|---|---|---|---|
| June 2025 | 38 | 1,787 | 2.1% |
| July 2025 | 64 | 1,617 | 4.0% |
| August 2025 | 46 | 1,451 | 3.2% |
| September 2025 | 65 | 1,560 | 4.2% |
| October 2025 | 52 | 1,450 | 3.6% |
| November 2025 | 44 | 1,505 | 2.9% |
| December 2025 | 35 | 1,603 | 2.2% |
| January 2026 | 40 | 1,739 | 2.3% |
| February 2026 | 31 | 1,607 | 1.9% |
| March 2026 | 37 | 1,843 | 2.0% |
| April 2026 | 32 | 1,725 | 1.9% |
| May 2026 | 46 | 1,797 | 2.6% |
| June 2026 | 49 | 1,697 | 2.9% |
| July 2026 | 57 | 1,733 | 3.3% |
| August 2026 | 43 | 1,557 | 2.8% |
| September 2026 | 47 | 1,777 | 2.6% |
Seasonal comparisons — matched periods
| Period | Appointments / qualifying | Share | Last year | Change |
|---|---|---|---|---|
| June 2025–August 2025 | 148 / 4,855 | 3.0% | June 2024–August 2024: Unavailable / Unavailable (Unavailable) | — |
| September 2025–November 2025 | 161 / 4,515 | 3.6% | September 2024–November 2024: Unavailable / Unavailable (Unavailable) | — |
| December 2025–February 2026 | 106 / 4,949 | 2.1% | December 2024–February 2025: Unavailable / Unavailable (Unavailable) | — |
| March 2026–May 2026 | 115 / 5,365 | 2.1% | March 2025–May 2025: Unavailable / Unavailable (Unavailable) | — |
| June 2026–August 2026 | 149 / 4,987 | 3.0% | June 2025–August 2025: 148 / 4,855 (3.0%) | -0.1 pp |
| September 2026 | 47 / 1,777 | 2.6% | September 2025: 65 / 1,560 (4.2%) | -1.5 pp |
Other/unspecified UTIView figures and history 0.6% 0.5% 0.6%0.8% last year
Other/unspecified UTI
Other or unspecified urinary tract infection concerns.
10 of 1,777 qualifying appointments addressed this concern.
Trailing 12 months: 101 appointments (0.5%) of 20,033.
Exact monthly figures — all saved history
| Month | Topic appointments | Qualifying appointments | Share |
|---|---|---|---|
| June 2025 | 12 | 1,787 | 0.7% |
| July 2025 | 8 | 1,617 | 0.5% |
| August 2025 | 8 | 1,451 | 0.6% |
| September 2025 | 12 | 1,560 | 0.8% |
| October 2025 | 8 | 1,450 | 0.6% |
| November 2025 | 8 | 1,505 | 0.5% |
| December 2025 | 8 | 1,603 | 0.5% |
| January 2026 | 11 | 1,739 | 0.6% |
| February 2026 | 5 | 1,607 | 0.3% |
| March 2026 | 10 | 1,843 | 0.5% |
| April 2026 | 12 | 1,725 | 0.7% |
| May 2026 | 8 | 1,797 | 0.4% |
| June 2026 | 7 | 1,697 | 0.4% |
| July 2026 | 7 | 1,733 | 0.4% |
| August 2026 | 7 | 1,557 | 0.4% |
| September 2026 | 10 | 1,777 | 0.6% |
Seasonal comparisons — matched periods
| Period | Appointments / qualifying | Share | Last year | Change |
|---|---|---|---|---|
| June 2025–August 2025 | 28 / 4,855 | 0.6% | June 2024–August 2024: Unavailable / Unavailable (Unavailable) | — |
| September 2025–November 2025 | 28 / 4,515 | 0.6% | September 2024–November 2024: Unavailable / Unavailable (Unavailable) | — |
| December 2025–February 2026 | 24 / 4,949 | 0.5% | December 2024–February 2025: Unavailable / Unavailable (Unavailable) | — |
| March 2026–May 2026 | 30 / 5,365 | 0.6% | March 2025–May 2025: Unavailable / Unavailable (Unavailable) | — |
| June 2026–August 2026 | 21 / 4,987 | 0.4% | June 2025–August 2025: 28 / 4,855 (0.6%) | -0.2 pp |
| September 2026 | 10 / 1,777 | 0.6% | September 2025: 12 / 1,560 (0.8%) | -0.2 pp |
Kidney infectionView figures and history 0.3% 0.3% 0.3%0.6% last year
Kidney infection
Kidney infection specifically discussed or assessed, including suspected infection.
6 of 1,777 qualifying appointments addressed this concern.
Trailing 12 months: 67 appointments (0.3%) of 20,033.
Exact monthly figures — all saved history
| Month | Topic appointments | Qualifying appointments | Share |
|---|---|---|---|
| June 2025 | 8 | 1,787 | 0.4% |
| July 2025 | 7 | 1,617 | 0.4% |
| August 2025 | 5 | 1,451 | 0.3% |
| September 2025 | 9 | 1,560 | 0.6% |
| October 2025 | 3 | 1,450 | 0.2% |
| November 2025 | 3 | 1,505 | 0.2% |
| December 2025 | 8 | 1,603 | 0.5% |
| January 2026 | 10 | 1,739 | 0.6% |
| February 2026 | 5 | 1,607 | 0.3% |
| March 2026 | 6 | 1,843 | 0.3% |
| April 2026 | 5 | 1,725 | 0.3% |
| May 2026 | 6 | 1,797 | 0.3% |
| June 2026 | 3 | 1,697 | 0.2% |
| July 2026 | 5 | 1,733 | 0.3% |
| August 2026 | 7 | 1,557 | 0.4% |
| September 2026 | 6 | 1,777 | 0.3% |
Seasonal comparisons — matched periods
| Period | Appointments / qualifying | Share | Last year | Change |
|---|---|---|---|---|
| June 2025–August 2025 | 20 / 4,855 | 0.4% | June 2024–August 2024: Unavailable / Unavailable (Unavailable) | — |
| September 2025–November 2025 | 15 / 4,515 | 0.3% | September 2024–November 2024: Unavailable / Unavailable (Unavailable) | — |
| December 2025–February 2026 | 23 / 4,949 | 0.5% | December 2024–February 2025: Unavailable / Unavailable (Unavailable) | — |
| March 2026–May 2026 | 17 / 5,365 | 0.3% | March 2025–May 2025: Unavailable / Unavailable (Unavailable) | — |
| June 2026–August 2026 | 15 / 4,987 | 0.3% | June 2025–August 2025: 20 / 4,855 (0.4%) | -0.1 pp |
| September 2026 | 6 / 1,777 | 0.3% | September 2025: 9 / 1,560 (0.6%) | -0.2 pp |
View trends
Urinary tract infections
Lower urinary tract infections, kidney infections and other urinary tract infection concerns, including suspected infections.
63 of 1,777 qualifying appointments addressed this concern.
Trailing 12 months: 680 appointments (3.4%) of 20,033.
Exact monthly figures — all saved history
| Month | Topic appointments | Qualifying appointments | Share |
|---|---|---|---|
| June 2025 | 57 | 1,787 | 3.2% |
| July 2025 | 79 | 1,617 | 4.9% |
| August 2025 | 59 | 1,451 | 4.1% |
| September 2025 | 86 | 1,560 | 5.5% |
| October 2025 | 63 | 1,450 | 4.3% |
| November 2025 | 55 | 1,505 | 3.7% |
| December 2025 | 51 | 1,603 | 3.2% |
| January 2026 | 60 | 1,739 | 3.5% |
| February 2026 | 41 | 1,607 | 2.6% |
| March 2026 | 53 | 1,843 | 2.9% |
| April 2026 | 49 | 1,725 | 2.8% |
| May 2026 | 60 | 1,797 | 3.3% |
| June 2026 | 59 | 1,697 | 3.5% |
| July 2026 | 69 | 1,733 | 4.0% |
| August 2026 | 57 | 1,557 | 3.7% |
| September 2026 | 63 | 1,777 | 3.5% |
Seasonal comparisons — matched periods
| Period | Appointments / qualifying | Share | Last year | Change |
|---|---|---|---|---|
| June 2025–August 2025 | 195 / 4,855 | 4.0% | June 2024–August 2024: Unavailable / Unavailable (Unavailable) | — |
| September 2025–November 2025 | 204 / 4,515 | 4.5% | September 2024–November 2024: Unavailable / Unavailable (Unavailable) | — |
| December 2025–February 2026 | 152 / 4,949 | 3.1% | December 2024–February 2025: Unavailable / Unavailable (Unavailable) | — |
| March 2026–May 2026 | 162 / 5,365 | 3.0% | March 2025–May 2025: Unavailable / Unavailable (Unavailable) | — |
| June 2026–August 2026 | 185 / 4,987 | 3.7% | June 2025–August 2025: 195 / 4,855 (4.0%) | -0.3 pp |
| September 2026 | 63 / 1,777 | 3.5% | September 2025: 86 / 1,560 (5.5%) | -2.0 pp |
Other urinary symptomsView figures and history 1.9% 1.8% 1.9%1.9% last year
Other urinary symptoms
Other urinary symptoms without a more specific recorded category.
34 of 1,777 qualifying appointments addressed this concern.
Trailing 12 months: 364 appointments (1.8%) of 20,033.
Exact monthly figures — all saved history
| Month | Topic appointments | Qualifying appointments | Share |
|---|---|---|---|
| June 2025 | 28 | 1,787 | 1.6% |
| July 2025 | 21 | 1,617 | 1.3% |
| August 2025 | 25 | 1,451 | 1.7% |
| September 2025 | 30 | 1,560 | 1.9% |
| October 2025 | 31 | 1,450 | 2.1% |
| November 2025 | 33 | 1,505 | 2.2% |
| December 2025 | 22 | 1,603 | 1.4% |
| January 2026 | 33 | 1,739 | 1.9% |
| February 2026 | 28 | 1,607 | 1.7% |
| March 2026 | 41 | 1,843 | 2.2% |
| April 2026 | 27 | 1,725 | 1.6% |
| May 2026 | 22 | 1,797 | 1.2% |
| June 2026 | 29 | 1,697 | 1.7% |
| July 2026 | 35 | 1,733 | 2.0% |
| August 2026 | 29 | 1,557 | 1.9% |
| September 2026 | 34 | 1,777 | 1.9% |
Seasonal comparisons — matched periods
| Period | Appointments / qualifying | Share | Last year | Change |
|---|---|---|---|---|
| June 2025–August 2025 | 74 / 4,855 | 1.5% | June 2024–August 2024: Unavailable / Unavailable (Unavailable) | — |
| September 2025–November 2025 | 94 / 4,515 | 2.1% | September 2024–November 2024: Unavailable / Unavailable (Unavailable) | — |
| December 2025–February 2026 | 83 / 4,949 | 1.7% | December 2024–February 2025: Unavailable / Unavailable (Unavailable) | — |
| March 2026–May 2026 | 90 / 5,365 | 1.7% | March 2025–May 2025: Unavailable / Unavailable (Unavailable) | — |
| June 2026–August 2026 | 93 / 4,987 | 1.9% | June 2025–August 2025: 74 / 4,855 (1.5%) | +0.3 pp |
| September 2026 | 34 / 1,777 | 1.9% | September 2025: 30 / 1,560 (1.9%) | 0.0 pp |
Kidney stonesView figures and history 0.4% 0.3% 0.4%0.4% last year
Kidney stones
Kidney stones specifically discussed or assessed.
7 of 1,777 qualifying appointments addressed this concern.
Trailing 12 months: 55 appointments (0.3%) of 20,033.
Exact monthly figures — all saved history
| Month | Topic appointments | Qualifying appointments | Share |
|---|---|---|---|
| June 2025 | 6 | 1,787 | 0.3% |
| July 2025 | 0 | 1,617 | 0.0% |
| August 2025 | 2 | 1,451 | 0.1% |
| September 2025 | 7 | 1,560 | 0.4% |
| October 2025 | 1 | 1,450 | 0.1% |
| November 2025 | 7 | 1,505 | 0.5% |
| December 2025 | 4 | 1,603 | 0.2% |
| January 2026 | 4 | 1,739 | 0.2% |
| February 2026 | 4 | 1,607 | 0.2% |
| March 2026 | 10 | 1,843 | 0.5% |
| April 2026 | 7 | 1,725 | 0.4% |
| May 2026 | 1 | 1,797 | 0.1% |
| June 2026 | 4 | 1,697 | 0.2% |
| July 2026 | 2 | 1,733 | 0.1% |
| August 2026 | 4 | 1,557 | 0.3% |
| September 2026 | 7 | 1,777 | 0.4% |
Seasonal comparisons — matched periods
| Period | Appointments / qualifying | Share | Last year | Change |
|---|---|---|---|---|
| June 2025–August 2025 | 8 / 4,855 | 0.2% | June 2024–August 2024: Unavailable / Unavailable (Unavailable) | — |
| September 2025–November 2025 | 15 / 4,515 | 0.3% | September 2024–November 2024: Unavailable / Unavailable (Unavailable) | — |
| December 2025–February 2026 | 12 / 4,949 | 0.2% | December 2024–February 2025: Unavailable / Unavailable (Unavailable) | — |
| March 2026–May 2026 | 18 / 5,365 | 0.3% | March 2025–May 2025: Unavailable / Unavailable (Unavailable) | — |
| June 2026–August 2026 | 10 / 4,987 | 0.2% | June 2025–August 2025: 8 / 4,855 (0.2%) | 0.0 pp |
| September 2026 | 7 / 1,777 | 0.4% | September 2025: 7 / 1,560 (0.4%) | -0.1 pp |
Other kidney concernsView figures and history 0.1% 0.4% 0.1%0.4% last year
Other kidney concerns
Other kidney-related symptoms or concerns.
2 of 1,777 qualifying appointments addressed this concern.
Trailing 12 months: 73 appointments (0.4%) of 20,033.
Exact monthly figures — all saved history
| Month | Topic appointments | Qualifying appointments | Share |
|---|---|---|---|
| June 2025 | 4 | 1,787 | 0.2% |
| July 2025 | 4 | 1,617 | 0.2% |
| August 2025 | 8 | 1,451 | 0.6% |
| September 2025 | 7 | 1,560 | 0.4% |
| October 2025 | 3 | 1,450 | 0.2% |
| November 2025 | 3 | 1,505 | 0.2% |
| December 2025 | 4 | 1,603 | 0.2% |
| January 2026 | 7 | 1,739 | 0.4% |
| February 2026 | 8 | 1,607 | 0.5% |
| March 2026 | 7 | 1,843 | 0.4% |
| April 2026 | 12 | 1,725 | 0.7% |
| May 2026 | 5 | 1,797 | 0.3% |
| June 2026 | 7 | 1,697 | 0.4% |
| July 2026 | 6 | 1,733 | 0.3% |
| August 2026 | 9 | 1,557 | 0.6% |
| September 2026 | 2 | 1,777 | 0.1% |
Seasonal comparisons — matched periods
| Period | Appointments / qualifying | Share | Last year | Change |
|---|---|---|---|---|
| June 2025–August 2025 | 16 / 4,855 | 0.3% | June 2024–August 2024: Unavailable / Unavailable (Unavailable) | — |
| September 2025–November 2025 | 13 / 4,515 | 0.3% | September 2024–November 2024: Unavailable / Unavailable (Unavailable) | — |
| December 2025–February 2026 | 19 / 4,949 | 0.4% | December 2024–February 2025: Unavailable / Unavailable (Unavailable) | — |
| March 2026–May 2026 | 24 / 5,365 | 0.4% | March 2025–May 2025: Unavailable / Unavailable (Unavailable) | — |
| June 2026–August 2026 | 22 / 4,987 | 0.4% | June 2025–August 2025: 16 / 4,855 (0.3%) | +0.1 pp |
| September 2026 | 2 / 1,777 | 0.1% | September 2025: 7 / 1,560 (0.4%) | -0.3 pp |
Chronic kidney diseaseView figures and history 0.1% 0.0% 0.1%0.1% last year
Chronic kidney disease
Chronic kidney disease specifically discussed or reviewed.
1 of 1,777 qualifying appointments addressed this concern.
Trailing 12 months: 8 appointments (0.0%) of 20,033.
Exact monthly figures — all saved history
| Month | Topic appointments | Qualifying appointments | Share |
|---|---|---|---|
| June 2025 | 2 | 1,787 | 0.1% |
| July 2025 | 0 | 1,617 | 0.0% |
| August 2025 | 1 | 1,451 | 0.1% |
| September 2025 | 2 | 1,560 | 0.1% |
| October 2025 | 1 | 1,450 | 0.1% |
| November 2025 | 0 | 1,505 | 0.0% |
| December 2025 | 0 | 1,603 | 0.0% |
| January 2026 | 1 | 1,739 | 0.1% |
| February 2026 | 2 | 1,607 | 0.1% |
| March 2026 | 0 | 1,843 | 0.0% |
| April 2026 | 2 | 1,725 | 0.1% |
| May 2026 | 0 | 1,797 | 0.0% |
| June 2026 | 1 | 1,697 | 0.1% |
| July 2026 | 0 | 1,733 | 0.0% |
| August 2026 | 0 | 1,557 | 0.0% |
| September 2026 | 1 | 1,777 | 0.1% |
Seasonal comparisons — matched periods
| Period | Appointments / qualifying | Share | Last year | Change |
|---|---|---|---|---|
| June 2025–August 2025 | 3 / 4,855 | 0.1% | June 2024–August 2024: Unavailable / Unavailable (Unavailable) | — |
| September 2025–November 2025 | 3 / 4,515 | 0.1% | September 2024–November 2024: Unavailable / Unavailable (Unavailable) | — |
| December 2025–February 2026 | 3 / 4,949 | 0.1% | December 2024–February 2025: Unavailable / Unavailable (Unavailable) | — |
| March 2026–May 2026 | 2 / 5,365 | 0.0% | March 2025–May 2025: Unavailable / Unavailable (Unavailable) | — |
| June 2026–August 2026 | 1 / 4,987 | 0.0% | June 2025–August 2025: 3 / 4,855 (0.1%) | 0.0 pp |
| September 2026 | 1 / 1,777 | 0.1% | September 2025: 2 / 1,560 (0.1%) | -0.1 pp |
View trends
Urinary & kidney
Urinary symptoms, urinary tract infections and kidney concerns.
102 of 1,777 qualifying appointments addressed this concern.
Trailing 12 months: 1,138 appointments (5.7%) of 20,033.
Exact monthly figures — all saved history
| Month | Topic appointments | Qualifying appointments | Share |
|---|---|---|---|
| June 2025 | 96 | 1,787 | 5.4% |
| July 2025 | 102 | 1,617 | 6.3% |
| August 2025 | 93 | 1,451 | 6.4% |
| September 2025 | 121 | 1,560 | 7.8% |
| October 2025 | 99 | 1,450 | 6.8% |
| November 2025 | 96 | 1,505 | 6.4% |
| December 2025 | 74 | 1,603 | 4.6% |
| January 2026 | 103 | 1,739 | 5.9% |
| February 2026 | 78 | 1,607 | 4.9% |
| March 2026 | 107 | 1,843 | 5.8% |
| April 2026 | 92 | 1,725 | 5.3% |
| May 2026 | 84 | 1,797 | 4.7% |
| June 2026 | 97 | 1,697 | 5.7% |
| July 2026 | 110 | 1,733 | 6.3% |
| August 2026 | 96 | 1,557 | 6.2% |
| September 2026 | 102 | 1,777 | 5.7% |
Seasonal comparisons — matched periods
| Period | Appointments / qualifying | Share | Last year | Change |
|---|---|---|---|---|
| June 2025–August 2025 | 291 / 4,855 | 6.0% | June 2024–August 2024: Unavailable / Unavailable (Unavailable) | — |
| September 2025–November 2025 | 316 / 4,515 | 7.0% | September 2024–November 2024: Unavailable / Unavailable (Unavailable) | — |
| December 2025–February 2026 | 255 / 4,949 | 5.2% | December 2024–February 2025: Unavailable / Unavailable (Unavailable) | — |
| March 2026–May 2026 | 283 / 5,365 | 5.3% | March 2025–May 2025: Unavailable / Unavailable (Unavailable) | — |
| June 2026–August 2026 | 303 / 4,987 | 6.1% | June 2025–August 2025: 291 / 4,855 (6.0%) | +0.1 pp |
| September 2026 | 102 / 1,777 | 5.7% | September 2025: 121 / 1,560 (7.8%) | -2.0 pp |
Tiredness & general symptomsShow 6 topics Hide topics 5.6% 6.3% 5.6%5.5% last year
Fatigue & tirednessView figures and history 3.2% 3.1% 3.2%2.9% last year
Fatigue & tiredness
Fatigue or tiredness assessed without a more specific recorded cause.
57 of 1,777 qualifying appointments addressed this concern.
Trailing 12 months: 619 appointments (3.1%) of 20,033.
Exact monthly figures — all saved history
| Month | Topic appointments | Qualifying appointments | Share |
|---|---|---|---|
| June 2025 | 42 | 1,787 | 2.4% |
| July 2025 | 46 | 1,617 | 2.8% |
| August 2025 | 31 | 1,451 | 2.1% |
| September 2025 | 45 | 1,560 | 2.9% |
| October 2025 | 34 | 1,450 | 2.3% |
| November 2025 | 34 | 1,505 | 2.3% |
| December 2025 | 34 | 1,603 | 2.1% |
| January 2026 | 42 | 1,739 | 2.4% |
| February 2026 | 49 | 1,607 | 3.0% |
| March 2026 | 67 | 1,843 | 3.6% |
| April 2026 | 61 | 1,725 | 3.5% |
| May 2026 | 65 | 1,797 | 3.6% |
| June 2026 | 67 | 1,697 | 3.9% |
| July 2026 | 62 | 1,733 | 3.6% |
| August 2026 | 47 | 1,557 | 3.0% |
| September 2026 | 57 | 1,777 | 3.2% |
Seasonal comparisons — matched periods
| Period | Appointments / qualifying | Share | Last year | Change |
|---|---|---|---|---|
| June 2025–August 2025 | 119 / 4,855 | 2.5% | June 2024–August 2024: Unavailable / Unavailable (Unavailable) | — |
| September 2025–November 2025 | 113 / 4,515 | 2.5% | September 2024–November 2024: Unavailable / Unavailable (Unavailable) | — |
| December 2025–February 2026 | 125 / 4,949 | 2.5% | December 2024–February 2025: Unavailable / Unavailable (Unavailable) | — |
| March 2026–May 2026 | 193 / 5,365 | 3.6% | March 2025–May 2025: Unavailable / Unavailable (Unavailable) | — |
| June 2026–August 2026 | 176 / 4,987 | 3.5% | June 2025–August 2025: 119 / 4,855 (2.5%) | +1.1 pp |
| September 2026 | 57 / 1,777 | 3.2% | September 2025: 45 / 1,560 (2.9%) | +0.3 pp |
Lymph nodes & unexplained lumpsView figures and history 1.1% 1.6% 1.1%1.7% last year
Lymph nodes & unexplained lumps
Lymph nodes or unexplained lumps discussed or assessed.
20 of 1,777 qualifying appointments addressed this concern.
Trailing 12 months: 318 appointments (1.6%) of 20,033.
Exact monthly figures — all saved history
| Month | Topic appointments | Qualifying appointments | Share |
|---|---|---|---|
| June 2025 | 17 | 1,787 | 1.0% |
| July 2025 | 24 | 1,617 | 1.5% |
| August 2025 | 18 | 1,451 | 1.2% |
| September 2025 | 26 | 1,560 | 1.7% |
| October 2025 | 18 | 1,450 | 1.2% |
| November 2025 | 28 | 1,505 | 1.9% |
| December 2025 | 27 | 1,603 | 1.7% |
| January 2026 | 27 | 1,739 | 1.6% |
| February 2026 | 24 | 1,607 | 1.5% |
| March 2026 | 38 | 1,843 | 2.1% |
| April 2026 | 31 | 1,725 | 1.8% |
| May 2026 | 26 | 1,797 | 1.4% |
| June 2026 | 30 | 1,697 | 1.8% |
| July 2026 | 19 | 1,733 | 1.1% |
| August 2026 | 30 | 1,557 | 1.9% |
| September 2026 | 20 | 1,777 | 1.1% |
Seasonal comparisons — matched periods
| Period | Appointments / qualifying | Share | Last year | Change |
|---|---|---|---|---|
| June 2025–August 2025 | 59 / 4,855 | 1.2% | June 2024–August 2024: Unavailable / Unavailable (Unavailable) | — |
| September 2025–November 2025 | 72 / 4,515 | 1.6% | September 2024–November 2024: Unavailable / Unavailable (Unavailable) | — |
| December 2025–February 2026 | 78 / 4,949 | 1.6% | December 2024–February 2025: Unavailable / Unavailable (Unavailable) | — |
| March 2026–May 2026 | 95 / 5,365 | 1.8% | March 2025–May 2025: Unavailable / Unavailable (Unavailable) | — |
| June 2026–August 2026 | 79 / 4,987 | 1.6% | June 2025–August 2025: 59 / 4,855 (1.2%) | +0.4 pp |
| September 2026 | 20 / 1,777 | 1.1% | September 2025: 26 / 1,560 (1.7%) | -0.5 pp |
Other general symptomsView figures and history 1.1% 1.0% 1.1%0.8% last year
Other general symptoms
Other general symptoms without a more specific recorded category.
20 of 1,777 qualifying appointments addressed this concern.
Trailing 12 months: 206 appointments (1.0%) of 20,033.
Exact monthly figures — all saved history
| Month | Topic appointments | Qualifying appointments | Share |
|---|---|---|---|
| June 2025 | 9 | 1,787 | 0.5% |
| July 2025 | 18 | 1,617 | 1.1% |
| August 2025 | 15 | 1,451 | 1.0% |
| September 2025 | 12 | 1,560 | 0.8% |
| October 2025 | 16 | 1,450 | 1.1% |
| November 2025 | 12 | 1,505 | 0.8% |
| December 2025 | 21 | 1,603 | 1.3% |
| January 2026 | 20 | 1,739 | 1.2% |
| February 2026 | 14 | 1,607 | 0.9% |
| March 2026 | 12 | 1,843 | 0.7% |
| April 2026 | 16 | 1,725 | 0.9% |
| May 2026 | 24 | 1,797 | 1.3% |
| June 2026 | 17 | 1,697 | 1.0% |
| July 2026 | 22 | 1,733 | 1.3% |
| August 2026 | 12 | 1,557 | 0.8% |
| September 2026 | 20 | 1,777 | 1.1% |
Seasonal comparisons — matched periods
| Period | Appointments / qualifying | Share | Last year | Change |
|---|---|---|---|---|
| June 2025–August 2025 | 42 / 4,855 | 0.9% | June 2024–August 2024: Unavailable / Unavailable (Unavailable) | — |
| September 2025–November 2025 | 40 / 4,515 | 0.9% | September 2024–November 2024: Unavailable / Unavailable (Unavailable) | — |
| December 2025–February 2026 | 55 / 4,949 | 1.1% | December 2024–February 2025: Unavailable / Unavailable (Unavailable) | — |
| March 2026–May 2026 | 52 / 5,365 | 1.0% | March 2025–May 2025: Unavailable / Unavailable (Unavailable) | — |
| June 2026–August 2026 | 51 / 4,987 | 1.0% | June 2025–August 2025: 42 / 4,855 (0.9%) | +0.2 pp |
| September 2026 | 20 / 1,777 | 1.1% | September 2025: 12 / 1,560 (0.8%) | +0.4 pp |
Vitamin & mineral deficienciesShow 4 topics Hide topics 0.5% 0.4% 0.5%0.4% last year
Iron deficiency without anaemiaView figures and history 0.2% 0.2% 0.2%0.3% last year
Iron deficiency without anaemia
Iron deficiency without anaemia specifically discussed or assessed.
4 of 1,777 qualifying appointments addressed this concern.
Trailing 12 months: 34 appointments (0.2%) of 20,033.
Exact monthly figures — all saved history
| Month | Topic appointments | Qualifying appointments | Share |
|---|---|---|---|
| June 2025 | 2 | 1,787 | 0.1% |
| July 2025 | 0 | 1,617 | 0.0% |
| August 2025 | 4 | 1,451 | 0.3% |
| September 2025 | 4 | 1,560 | 0.3% |
| October 2025 | 4 | 1,450 | 0.3% |
| November 2025 | 1 | 1,505 | 0.1% |
| December 2025 | 1 | 1,603 | 0.1% |
| January 2026 | 1 | 1,739 | 0.1% |
| February 2026 | 2 | 1,607 | 0.1% |
| March 2026 | 1 | 1,843 | 0.1% |
| April 2026 | 4 | 1,725 | 0.2% |
| May 2026 | 3 | 1,797 | 0.2% |
| June 2026 | 2 | 1,697 | 0.1% |
| July 2026 | 8 | 1,733 | 0.5% |
| August 2026 | 3 | 1,557 | 0.2% |
| September 2026 | 4 | 1,777 | 0.2% |
Seasonal comparisons — matched periods
| Period | Appointments / qualifying | Share | Last year | Change |
|---|---|---|---|---|
| June 2025–August 2025 | 6 / 4,855 | 0.1% | June 2024–August 2024: Unavailable / Unavailable (Unavailable) | — |
| September 2025–November 2025 | 9 / 4,515 | 0.2% | September 2024–November 2024: Unavailable / Unavailable (Unavailable) | — |
| December 2025–February 2026 | 4 / 4,949 | 0.1% | December 2024–February 2025: Unavailable / Unavailable (Unavailable) | — |
| March 2026–May 2026 | 8 / 5,365 | 0.1% | March 2025–May 2025: Unavailable / Unavailable (Unavailable) | — |
| June 2026–August 2026 | 13 / 4,987 | 0.3% | June 2025–August 2025: 6 / 4,855 (0.1%) | +0.1 pp |
| September 2026 | 4 / 1,777 | 0.2% | September 2025: 4 / 1,560 (0.3%) | 0.0 pp |
Vitamin DView figures and history 0.2% 0.2% 0.2%0.1% last year
Vitamin D
Vitamin D deficiency concerns discussed or assessed.
3 of 1,777 qualifying appointments addressed this concern.
Trailing 12 months: 33 appointments (0.2%) of 20,033.
Exact monthly figures — all saved history
| Month | Topic appointments | Qualifying appointments | Share |
|---|---|---|---|
| June 2025 | 1 | 1,787 | 0.1% |
| July 2025 | 2 | 1,617 | 0.1% |
| August 2025 | 1 | 1,451 | 0.1% |
| September 2025 | 1 | 1,560 | 0.1% |
| October 2025 | 3 | 1,450 | 0.2% |
| November 2025 | 3 | 1,505 | 0.2% |
| December 2025 | 2 | 1,603 | 0.1% |
| January 2026 | 3 | 1,739 | 0.2% |
| February 2026 | 5 | 1,607 | 0.3% |
| March 2026 | 1 | 1,843 | 0.1% |
| April 2026 | 6 | 1,725 | 0.3% |
| May 2026 | 1 | 1,797 | 0.1% |
| June 2026 | 1 | 1,697 | 0.1% |
| July 2026 | 4 | 1,733 | 0.2% |
| August 2026 | 1 | 1,557 | 0.1% |
| September 2026 | 3 | 1,777 | 0.2% |
Seasonal comparisons — matched periods
| Period | Appointments / qualifying | Share | Last year | Change |
|---|---|---|---|---|
| June 2025–August 2025 | 4 / 4,855 | 0.1% | June 2024–August 2024: Unavailable / Unavailable (Unavailable) | — |
| September 2025–November 2025 | 7 / 4,515 | 0.2% | September 2024–November 2024: Unavailable / Unavailable (Unavailable) | — |
| December 2025–February 2026 | 10 / 4,949 | 0.2% | December 2024–February 2025: Unavailable / Unavailable (Unavailable) | — |
| March 2026–May 2026 | 8 / 5,365 | 0.1% | March 2025–May 2025: Unavailable / Unavailable (Unavailable) | — |
| June 2026–August 2026 | 6 / 4,987 | 0.1% | June 2025–August 2025: 4 / 4,855 (0.1%) | 0.0 pp |
| September 2026 | 3 / 1,777 | 0.2% | September 2025: 1 / 1,560 (0.1%) | +0.1 pp |
Other deficienciesView figures and history 0.1% 0.0% 0.1%0.1% last year
Other deficiencies
Other vitamin or mineral deficiency concerns.
1 of 1,777 qualifying appointments addressed this concern.
Trailing 12 months: 8 appointments (0.0%) of 20,033.
Exact monthly figures — all saved history
| Month | Topic appointments | Qualifying appointments | Share |
|---|---|---|---|
| June 2025 | 1 | 1,787 | 0.1% |
| July 2025 | 0 | 1,617 | 0.0% |
| August 2025 | 0 | 1,451 | 0.0% |
| September 2025 | 1 | 1,560 | 0.1% |
| October 2025 | 1 | 1,450 | 0.1% |
| November 2025 | 1 | 1,505 | 0.1% |
| December 2025 | 2 | 1,603 | 0.1% |
| January 2026 | 0 | 1,739 | 0.0% |
| February 2026 | 0 | 1,607 | 0.0% |
| March 2026 | 0 | 1,843 | 0.0% |
| April 2026 | 0 | 1,725 | 0.0% |
| May 2026 | 2 | 1,797 | 0.1% |
| June 2026 | 1 | 1,697 | 0.1% |
| July 2026 | 0 | 1,733 | 0.0% |
| August 2026 | 0 | 1,557 | 0.0% |
| September 2026 | 1 | 1,777 | 0.1% |
Seasonal comparisons — matched periods
| Period | Appointments / qualifying | Share | Last year | Change |
|---|---|---|---|---|
| June 2025–August 2025 | 1 / 4,855 | 0.0% | June 2024–August 2024: Unavailable / Unavailable (Unavailable) | — |
| September 2025–November 2025 | 3 / 4,515 | 0.1% | September 2024–November 2024: Unavailable / Unavailable (Unavailable) | — |
| December 2025–February 2026 | 2 / 4,949 | 0.0% | December 2024–February 2025: Unavailable / Unavailable (Unavailable) | — |
| March 2026–May 2026 | 2 / 5,365 | 0.0% | March 2025–May 2025: Unavailable / Unavailable (Unavailable) | — |
| June 2026–August 2026 | 1 / 4,987 | 0.0% | June 2025–August 2025: 1 / 4,855 (0.0%) | 0.0 pp |
| September 2026 | 1 / 1,777 | 0.1% | September 2025: 1 / 1,560 (0.1%) | 0.0 pp |
B12/folateView figures and history 0.0% 0.1% 0.0%0.2% last year
B12/folate
Vitamin B12 or folate deficiency concerns discussed or assessed.
0 of 1,777 qualifying appointments addressed this concern.
Trailing 12 months: 12 appointments (0.1%) of 20,033.
Exact monthly figures — all saved history
| Month | Topic appointments | Qualifying appointments | Share |
|---|---|---|---|
| June 2025 | 0 | 1,787 | 0.0% |
| July 2025 | 2 | 1,617 | 0.1% |
| August 2025 | 2 | 1,451 | 0.1% |
| September 2025 | 3 | 1,560 | 0.2% |
| October 2025 | 0 | 1,450 | 0.0% |
| November 2025 | 1 | 1,505 | 0.1% |
| December 2025 | 1 | 1,603 | 0.1% |
| January 2026 | 2 | 1,739 | 0.1% |
| February 2026 | 1 | 1,607 | 0.1% |
| March 2026 | 1 | 1,843 | 0.1% |
| April 2026 | 2 | 1,725 | 0.1% |
| May 2026 | 1 | 1,797 | 0.1% |
| June 2026 | 1 | 1,697 | 0.1% |
| July 2026 | 1 | 1,733 | 0.1% |
| August 2026 | 1 | 1,557 | 0.1% |
| September 2026 | 0 | 1,777 | 0.0% |
Seasonal comparisons — matched periods
| Period | Appointments / qualifying | Share | Last year | Change |
|---|---|---|---|---|
| June 2025–August 2025 | 4 / 4,855 | 0.1% | June 2024–August 2024: Unavailable / Unavailable (Unavailable) | — |
| September 2025–November 2025 | 4 / 4,515 | 0.1% | September 2024–November 2024: Unavailable / Unavailable (Unavailable) | — |
| December 2025–February 2026 | 4 / 4,949 | 0.1% | December 2024–February 2025: Unavailable / Unavailable (Unavailable) | — |
| March 2026–May 2026 | 4 / 5,365 | 0.1% | March 2025–May 2025: Unavailable / Unavailable (Unavailable) | — |
| June 2026–August 2026 | 3 / 4,987 | 0.1% | June 2025–August 2025: 4 / 4,855 (0.1%) | 0.0 pp |
| September 2026 | 0 / 1,777 | 0.0% | September 2025: 3 / 1,560 (0.2%) | -0.2 pp |
View trends
Vitamin & mineral deficiencies
Iron, vitamin B12, folate, vitamin D and other vitamin or mineral deficiency concerns.
8 of 1,777 qualifying appointments addressed this concern.
Trailing 12 months: 81 appointments (0.4%) of 20,033.
Exact monthly figures — all saved history
| Month | Topic appointments | Qualifying appointments | Share |
|---|---|---|---|
| June 2025 | 3 | 1,787 | 0.2% |
| July 2025 | 4 | 1,617 | 0.2% |
| August 2025 | 6 | 1,451 | 0.4% |
| September 2025 | 7 | 1,560 | 0.4% |
| October 2025 | 7 | 1,450 | 0.5% |
| November 2025 | 5 | 1,505 | 0.3% |
| December 2025 | 6 | 1,603 | 0.4% |
| January 2026 | 5 | 1,739 | 0.3% |
| February 2026 | 8 | 1,607 | 0.5% |
| March 2026 | 3 | 1,843 | 0.2% |
| April 2026 | 11 | 1,725 | 0.6% |
| May 2026 | 7 | 1,797 | 0.4% |
| June 2026 | 3 | 1,697 | 0.2% |
| July 2026 | 13 | 1,733 | 0.8% |
| August 2026 | 5 | 1,557 | 0.3% |
| September 2026 | 8 | 1,777 | 0.5% |
Seasonal comparisons — matched periods
| Period | Appointments / qualifying | Share | Last year | Change |
|---|---|---|---|---|
| June 2025–August 2025 | 13 / 4,855 | 0.3% | June 2024–August 2024: Unavailable / Unavailable (Unavailable) | — |
| September 2025–November 2025 | 19 / 4,515 | 0.4% | September 2024–November 2024: Unavailable / Unavailable (Unavailable) | — |
| December 2025–February 2026 | 19 / 4,949 | 0.4% | December 2024–February 2025: Unavailable / Unavailable (Unavailable) | — |
| March 2026–May 2026 | 21 / 5,365 | 0.4% | March 2025–May 2025: Unavailable / Unavailable (Unavailable) | — |
| June 2026–August 2026 | 21 / 4,987 | 0.4% | June 2025–August 2025: 13 / 4,855 (0.3%) | +0.2 pp |
| September 2026 | 8 / 1,777 | 0.5% | September 2025: 7 / 1,560 (0.4%) | 0.0 pp |
AnaemiaShow 2 topics Hide topics 0.3% 0.4% 0.3%0.1% last year
Iron-deficiency anaemiaView figures and history 0.2% 0.1% 0.2%0.1% last year
Iron-deficiency anaemia
Iron-deficiency anaemia specifically discussed or assessed.
3 of 1,777 qualifying appointments addressed this concern.
Trailing 12 months: 26 appointments (0.1%) of 20,033.
Exact monthly figures — all saved history
| Month | Topic appointments | Qualifying appointments | Share |
|---|---|---|---|
| June 2025 | 1 | 1,787 | 0.1% |
| July 2025 | 3 | 1,617 | 0.2% |
| August 2025 | 0 | 1,451 | 0.0% |
| September 2025 | 1 | 1,560 | 0.1% |
| October 2025 | 2 | 1,450 | 0.1% |
| November 2025 | 2 | 1,505 | 0.1% |
| December 2025 | 3 | 1,603 | 0.2% |
| January 2026 | 0 | 1,739 | 0.0% |
| February 2026 | 2 | 1,607 | 0.1% |
| March 2026 | 4 | 1,843 | 0.2% |
| April 2026 | 1 | 1,725 | 0.1% |
| May 2026 | 1 | 1,797 | 0.1% |
| June 2026 | 4 | 1,697 | 0.2% |
| July 2026 | 1 | 1,733 | 0.1% |
| August 2026 | 3 | 1,557 | 0.2% |
| September 2026 | 3 | 1,777 | 0.2% |
Seasonal comparisons — matched periods
| Period | Appointments / qualifying | Share | Last year | Change |
|---|---|---|---|---|
| June 2025–August 2025 | 4 / 4,855 | 0.1% | June 2024–August 2024: Unavailable / Unavailable (Unavailable) | — |
| September 2025–November 2025 | 5 / 4,515 | 0.1% | September 2024–November 2024: Unavailable / Unavailable (Unavailable) | — |
| December 2025–February 2026 | 5 / 4,949 | 0.1% | December 2024–February 2025: Unavailable / Unavailable (Unavailable) | — |
| March 2026–May 2026 | 6 / 5,365 | 0.1% | March 2025–May 2025: Unavailable / Unavailable (Unavailable) | — |
| June 2026–August 2026 | 8 / 4,987 | 0.2% | June 2025–August 2025: 4 / 4,855 (0.1%) | +0.1 pp |
| September 2026 | 3 / 1,777 | 0.2% | September 2025: 1 / 1,560 (0.1%) | +0.1 pp |
Other anaemiaView figures and history 0.2% 0.2% 0.2%0.1% last year
Other anaemia
Other anaemia concerns.
3 of 1,777 qualifying appointments addressed this concern.
Trailing 12 months: 48 appointments (0.2%) of 20,033.
Exact monthly figures — all saved history
| Month | Topic appointments | Qualifying appointments | Share |
|---|---|---|---|
| June 2025 | 3 | 1,787 | 0.2% |
| July 2025 | 3 | 1,617 | 0.2% |
| August 2025 | 4 | 1,451 | 0.3% |
| September 2025 | 1 | 1,560 | 0.1% |
| October 2025 | 3 | 1,450 | 0.2% |
| November 2025 | 3 | 1,505 | 0.2% |
| December 2025 | 3 | 1,603 | 0.2% |
| January 2026 | 6 | 1,739 | 0.3% |
| February 2026 | 4 | 1,607 | 0.2% |
| March 2026 | 4 | 1,843 | 0.2% |
| April 2026 | 6 | 1,725 | 0.3% |
| May 2026 | 6 | 1,797 | 0.3% |
| June 2026 | 4 | 1,697 | 0.2% |
| July 2026 | 4 | 1,733 | 0.2% |
| August 2026 | 2 | 1,557 | 0.1% |
| September 2026 | 3 | 1,777 | 0.2% |
Seasonal comparisons — matched periods
| Period | Appointments / qualifying | Share | Last year | Change |
|---|---|---|---|---|
| June 2025–August 2025 | 10 / 4,855 | 0.2% | June 2024–August 2024: Unavailable / Unavailable (Unavailable) | — |
| September 2025–November 2025 | 7 / 4,515 | 0.2% | September 2024–November 2024: Unavailable / Unavailable (Unavailable) | — |
| December 2025–February 2026 | 13 / 4,949 | 0.3% | December 2024–February 2025: Unavailable / Unavailable (Unavailable) | — |
| March 2026–May 2026 | 16 / 5,365 | 0.3% | March 2025–May 2025: Unavailable / Unavailable (Unavailable) | — |
| June 2026–August 2026 | 10 / 4,987 | 0.2% | June 2025–August 2025: 10 / 4,855 (0.2%) | 0.0 pp |
| September 2026 | 3 / 1,777 | 0.2% | September 2025: 1 / 1,560 (0.1%) | +0.1 pp |
View trends
Anaemia
Iron-deficiency anaemia and other anaemia concerns.
6 of 1,777 qualifying appointments addressed this concern.
Trailing 12 months: 74 appointments (0.4%) of 20,033.
Exact monthly figures — all saved history
| Month | Topic appointments | Qualifying appointments | Share |
|---|---|---|---|
| June 2025 | 4 | 1,787 | 0.2% |
| July 2025 | 6 | 1,617 | 0.4% |
| August 2025 | 4 | 1,451 | 0.3% |
| September 2025 | 2 | 1,560 | 0.1% |
| October 2025 | 5 | 1,450 | 0.3% |
| November 2025 | 5 | 1,505 | 0.3% |
| December 2025 | 6 | 1,603 | 0.4% |
| January 2026 | 6 | 1,739 | 0.3% |
| February 2026 | 6 | 1,607 | 0.4% |
| March 2026 | 8 | 1,843 | 0.4% |
| April 2026 | 7 | 1,725 | 0.4% |
| May 2026 | 7 | 1,797 | 0.4% |
| June 2026 | 8 | 1,697 | 0.5% |
| July 2026 | 5 | 1,733 | 0.3% |
| August 2026 | 5 | 1,557 | 0.3% |
| September 2026 | 6 | 1,777 | 0.3% |
Seasonal comparisons — matched periods
| Period | Appointments / qualifying | Share | Last year | Change |
|---|---|---|---|---|
| June 2025–August 2025 | 14 / 4,855 | 0.3% | June 2024–August 2024: Unavailable / Unavailable (Unavailable) | — |
| September 2025–November 2025 | 12 / 4,515 | 0.3% | September 2024–November 2024: Unavailable / Unavailable (Unavailable) | — |
| December 2025–February 2026 | 18 / 4,949 | 0.4% | December 2024–February 2025: Unavailable / Unavailable (Unavailable) | — |
| March 2026–May 2026 | 22 / 5,365 | 0.4% | March 2025–May 2025: Unavailable / Unavailable (Unavailable) | — |
| June 2026–August 2026 | 18 / 4,987 | 0.4% | June 2025–August 2025: 14 / 4,855 (0.3%) | +0.1 pp |
| September 2026 | 6 / 1,777 | 0.3% | September 2025: 2 / 1,560 (0.1%) | +0.2 pp |
Fever & systemic illnessView figures and history 0.3% 0.4% 0.3%0.2% last year
Fever & systemic illness
Fever or systemic illness concerns discussed or assessed.
6 of 1,777 qualifying appointments addressed this concern.
Trailing 12 months: 83 appointments (0.4%) of 20,033.
Exact monthly figures — all saved history
| Month | Topic appointments | Qualifying appointments | Share |
|---|---|---|---|
| June 2025 | 5 | 1,787 | 0.3% |
| July 2025 | 7 | 1,617 | 0.4% |
| August 2025 | 7 | 1,451 | 0.5% |
| September 2025 | 3 | 1,560 | 0.2% |
| October 2025 | 3 | 1,450 | 0.2% |
| November 2025 | 3 | 1,505 | 0.2% |
| December 2025 | 6 | 1,603 | 0.4% |
| January 2026 | 4 | 1,739 | 0.2% |
| February 2026 | 4 | 1,607 | 0.2% |
| March 2026 | 8 | 1,843 | 0.4% |
| April 2026 | 10 | 1,725 | 0.6% |
| May 2026 | 11 | 1,797 | 0.6% |
| June 2026 | 12 | 1,697 | 0.7% |
| July 2026 | 9 | 1,733 | 0.5% |
| August 2026 | 7 | 1,557 | 0.4% |
| September 2026 | 6 | 1,777 | 0.3% |
Seasonal comparisons — matched periods
| Period | Appointments / qualifying | Share | Last year | Change |
|---|---|---|---|---|
| June 2025–August 2025 | 19 / 4,855 | 0.4% | June 2024–August 2024: Unavailable / Unavailable (Unavailable) | — |
| September 2025–November 2025 | 9 / 4,515 | 0.2% | September 2024–November 2024: Unavailable / Unavailable (Unavailable) | — |
| December 2025–February 2026 | 14 / 4,949 | 0.3% | December 2024–February 2025: Unavailable / Unavailable (Unavailable) | — |
| March 2026–May 2026 | 29 / 5,365 | 0.5% | March 2025–May 2025: Unavailable / Unavailable (Unavailable) | — |
| June 2026–August 2026 | 28 / 4,987 | 0.6% | June 2025–August 2025: 19 / 4,855 (0.4%) | +0.2 pp |
| September 2026 | 6 / 1,777 | 0.3% | September 2025: 3 / 1,560 (0.2%) | +0.1 pp |
View trends
Tiredness & general symptoms
Fatigue, anaemia, deficiency, fever and other general or unexplained symptoms.
99 of 1,777 qualifying appointments addressed this concern.
Trailing 12 months: 1,267 appointments (6.3%) of 20,033.
Exact monthly figures — all saved history
| Month | Topic appointments | Qualifying appointments | Share |
|---|---|---|---|
| June 2025 | 77 | 1,787 | 4.3% |
| July 2025 | 97 | 1,617 | 6.0% |
| August 2025 | 75 | 1,451 | 5.2% |
| September 2025 | 86 | 1,560 | 5.5% |
| October 2025 | 76 | 1,450 | 5.2% |
| November 2025 | 80 | 1,505 | 5.3% |
| December 2025 | 90 | 1,603 | 5.6% |
| January 2026 | 98 | 1,739 | 5.6% |
| February 2026 | 99 | 1,607 | 6.2% |
| March 2026 | 129 | 1,843 | 7.0% |
| April 2026 | 123 | 1,725 | 7.1% |
| May 2026 | 127 | 1,797 | 7.1% |
| June 2026 | 125 | 1,697 | 7.4% |
| July 2026 | 124 | 1,733 | 7.2% |
| August 2026 | 97 | 1,557 | 6.2% |
| September 2026 | 99 | 1,777 | 5.6% |
Seasonal comparisons — matched periods
| Period | Appointments / qualifying | Share | Last year | Change |
|---|---|---|---|---|
| June 2025–August 2025 | 249 / 4,855 | 5.1% | June 2024–August 2024: Unavailable / Unavailable (Unavailable) | — |
| September 2025–November 2025 | 242 / 4,515 | 5.4% | September 2024–November 2024: Unavailable / Unavailable (Unavailable) | — |
| December 2025–February 2026 | 287 / 4,949 | 5.8% | December 2024–February 2025: Unavailable / Unavailable (Unavailable) | — |
| March 2026–May 2026 | 379 / 5,365 | 7.1% | March 2025–May 2025: Unavailable / Unavailable (Unavailable) | — |
| June 2026–August 2026 | 346 / 4,987 | 6.9% | June 2025–August 2025: 249 / 4,855 (5.1%) | +1.8 pp |
| September 2026 | 99 / 1,777 | 5.6% | September 2025: 86 / 1,560 (5.5%) | +0.1 pp |
Lung & breathingShow 4 topics Hide topics 4.6% 4.5% 4.6%4.0% last year
AsthmaView figures and history 2.6% 2.2% 2.6%2.4% last year
Asthma
Asthma assessment, flare-ups or substantive reviews.
47 of 1,777 qualifying appointments addressed this concern.
Trailing 12 months: 442 appointments (2.2%) of 20,033.
Exact monthly figures — all saved history
| Month | Topic appointments | Qualifying appointments | Share |
|---|---|---|---|
| June 2025 | 28 | 1,787 | 1.6% |
| July 2025 | 27 | 1,617 | 1.7% |
| August 2025 | 15 | 1,451 | 1.0% |
| September 2025 | 38 | 1,560 | 2.4% |
| October 2025 | 50 | 1,450 | 3.4% |
| November 2025 | 40 | 1,505 | 2.7% |
| December 2025 | 46 | 1,603 | 2.9% |
| January 2026 | 48 | 1,739 | 2.8% |
| February 2026 | 34 | 1,607 | 2.1% |
| March 2026 | 46 | 1,843 | 2.5% |
| April 2026 | 22 | 1,725 | 1.3% |
| May 2026 | 30 | 1,797 | 1.7% |
| June 2026 | 35 | 1,697 | 2.1% |
| July 2026 | 30 | 1,733 | 1.7% |
| August 2026 | 14 | 1,557 | 0.9% |
| September 2026 | 47 | 1,777 | 2.6% |
Seasonal comparisons — matched periods
| Period | Appointments / qualifying | Share | Last year | Change |
|---|---|---|---|---|
| June 2025–August 2025 | 70 / 4,855 | 1.4% | June 2024–August 2024: Unavailable / Unavailable (Unavailable) | — |
| September 2025–November 2025 | 128 / 4,515 | 2.8% | September 2024–November 2024: Unavailable / Unavailable (Unavailable) | — |
| December 2025–February 2026 | 128 / 4,949 | 2.6% | December 2024–February 2025: Unavailable / Unavailable (Unavailable) | — |
| March 2026–May 2026 | 98 / 5,365 | 1.8% | March 2025–May 2025: Unavailable / Unavailable (Unavailable) | — |
| June 2026–August 2026 | 79 / 4,987 | 1.6% | June 2025–August 2025: 70 / 4,855 (1.4%) | +0.1 pp |
| September 2026 | 47 / 1,777 | 2.6% | September 2025: 38 / 1,560 (2.4%) | +0.2 pp |
Breathlessness & other lung concernsShow 2 topics Hide topics 1.0% 1.5% 1.0%1.1% last year
Unexplained breathlessnessView figures and history 0.7% 1.0% 0.7%0.5% last year
Unexplained breathlessness
Breathlessness assessed without an established cause recorded for that concern.
13 of 1,777 qualifying appointments addressed this concern.
Trailing 12 months: 199 appointments (1.0%) of 20,033.
Exact monthly figures — all saved history
| Month | Topic appointments | Qualifying appointments | Share |
|---|---|---|---|
| June 2025 | 8 | 1,787 | 0.4% |
| July 2025 | 12 | 1,617 | 0.7% |
| August 2025 | 23 | 1,451 | 1.6% |
| September 2025 | 8 | 1,560 | 0.5% |
| October 2025 | 17 | 1,450 | 1.2% |
| November 2025 | 7 | 1,505 | 0.5% |
| December 2025 | 13 | 1,603 | 0.8% |
| January 2026 | 19 | 1,739 | 1.1% |
| February 2026 | 15 | 1,607 | 0.9% |
| March 2026 | 20 | 1,843 | 1.1% |
| April 2026 | 22 | 1,725 | 1.3% |
| May 2026 | 21 | 1,797 | 1.2% |
| June 2026 | 23 | 1,697 | 1.4% |
| July 2026 | 15 | 1,733 | 0.9% |
| August 2026 | 14 | 1,557 | 0.9% |
| September 2026 | 13 | 1,777 | 0.7% |
Seasonal comparisons — matched periods
| Period | Appointments / qualifying | Share | Last year | Change |
|---|---|---|---|---|
| June 2025–August 2025 | 43 / 4,855 | 0.9% | June 2024–August 2024: Unavailable / Unavailable (Unavailable) | — |
| September 2025–November 2025 | 32 / 4,515 | 0.7% | September 2024–November 2024: Unavailable / Unavailable (Unavailable) | — |
| December 2025–February 2026 | 47 / 4,949 | 0.9% | December 2024–February 2025: Unavailable / Unavailable (Unavailable) | — |
| March 2026–May 2026 | 63 / 5,365 | 1.2% | March 2025–May 2025: Unavailable / Unavailable (Unavailable) | — |
| June 2026–August 2026 | 52 / 4,987 | 1.0% | June 2025–August 2025: 43 / 4,855 (0.9%) | +0.2 pp |
| September 2026 | 13 / 1,777 | 0.7% | September 2025: 8 / 1,560 (0.5%) | +0.2 pp |
Other lung conditionsView figures and history 0.3% 0.5% 0.3%0.6% last year
Other lung conditions
Other lung conditions or respiratory concerns.
6 of 1,777 qualifying appointments addressed this concern.
Trailing 12 months: 100 appointments (0.5%) of 20,033.
Exact monthly figures — all saved history
| Month | Topic appointments | Qualifying appointments | Share |
|---|---|---|---|
| June 2025 | 5 | 1,787 | 0.3% |
| July 2025 | 3 | 1,617 | 0.2% |
| August 2025 | 6 | 1,451 | 0.4% |
| September 2025 | 9 | 1,560 | 0.6% |
| October 2025 | 10 | 1,450 | 0.7% |
| November 2025 | 4 | 1,505 | 0.3% |
| December 2025 | 9 | 1,603 | 0.6% |
| January 2026 | 4 | 1,739 | 0.2% |
| February 2026 | 4 | 1,607 | 0.2% |
| March 2026 | 12 | 1,843 | 0.7% |
| April 2026 | 11 | 1,725 | 0.6% |
| May 2026 | 14 | 1,797 | 0.8% |
| June 2026 | 11 | 1,697 | 0.6% |
| July 2026 | 9 | 1,733 | 0.5% |
| August 2026 | 6 | 1,557 | 0.4% |
| September 2026 | 6 | 1,777 | 0.3% |
Seasonal comparisons — matched periods
| Period | Appointments / qualifying | Share | Last year | Change |
|---|---|---|---|---|
| June 2025–August 2025 | 14 / 4,855 | 0.3% | June 2024–August 2024: Unavailable / Unavailable (Unavailable) | — |
| September 2025–November 2025 | 23 / 4,515 | 0.5% | September 2024–November 2024: Unavailable / Unavailable (Unavailable) | — |
| December 2025–February 2026 | 17 / 4,949 | 0.3% | December 2024–February 2025: Unavailable / Unavailable (Unavailable) | — |
| March 2026–May 2026 | 37 / 5,365 | 0.7% | March 2025–May 2025: Unavailable / Unavailable (Unavailable) | — |
| June 2026–August 2026 | 26 / 4,987 | 0.5% | June 2025–August 2025: 14 / 4,855 (0.3%) | +0.2 pp |
| September 2026 | 6 / 1,777 | 0.3% | September 2025: 9 / 1,560 (0.6%) | -0.2 pp |
View trends
Breathlessness & other lung concerns
Unexplained breathlessness and other lung conditions or concerns.
18 of 1,777 qualifying appointments addressed this concern.
Trailing 12 months: 296 appointments (1.5%) of 20,033.
Exact monthly figures — all saved history
| Month | Topic appointments | Qualifying appointments | Share |
|---|---|---|---|
| June 2025 | 13 | 1,787 | 0.7% |
| July 2025 | 15 | 1,617 | 0.9% |
| August 2025 | 29 | 1,451 | 2.0% |
| September 2025 | 17 | 1,560 | 1.1% |
| October 2025 | 27 | 1,450 | 1.9% |
| November 2025 | 11 | 1,505 | 0.7% |
| December 2025 | 22 | 1,603 | 1.4% |
| January 2026 | 23 | 1,739 | 1.3% |
| February 2026 | 19 | 1,607 | 1.2% |
| March 2026 | 31 | 1,843 | 1.7% |
| April 2026 | 32 | 1,725 | 1.9% |
| May 2026 | 35 | 1,797 | 1.9% |
| June 2026 | 34 | 1,697 | 2.0% |
| July 2026 | 24 | 1,733 | 1.4% |
| August 2026 | 20 | 1,557 | 1.3% |
| September 2026 | 18 | 1,777 | 1.0% |
Seasonal comparisons — matched periods
| Period | Appointments / qualifying | Share | Last year | Change |
|---|---|---|---|---|
| June 2025–August 2025 | 57 / 4,855 | 1.2% | June 2024–August 2024: Unavailable / Unavailable (Unavailable) | — |
| September 2025–November 2025 | 55 / 4,515 | 1.2% | September 2024–November 2024: Unavailable / Unavailable (Unavailable) | — |
| December 2025–February 2026 | 64 / 4,949 | 1.3% | December 2024–February 2025: Unavailable / Unavailable (Unavailable) | — |
| March 2026–May 2026 | 98 / 5,365 | 1.8% | March 2025–May 2025: Unavailable / Unavailable (Unavailable) | — |
| June 2026–August 2026 | 78 / 4,987 | 1.6% | June 2025–August 2025: 57 / 4,855 (1.2%) | +0.4 pp |
| September 2026 | 18 / 1,777 | 1.0% | September 2025: 17 / 1,560 (1.1%) | -0.1 pp |
Persistent coughView figures and history 0.6% 0.9% 0.6%0.6% last year
Persistent cough
Persistent or chronic cough assessed without a more specific recorded cause.
11 of 1,777 qualifying appointments addressed this concern.
Trailing 12 months: 183 appointments (0.9%) of 20,033.
Exact monthly figures — all saved history
| Month | Topic appointments | Qualifying appointments | Share |
|---|---|---|---|
| June 2025 | 20 | 1,787 | 1.1% |
| July 2025 | 7 | 1,617 | 0.4% |
| August 2025 | 9 | 1,451 | 0.6% |
| September 2025 | 10 | 1,560 | 0.6% |
| October 2025 | 15 | 1,450 | 1.0% |
| November 2025 | 17 | 1,505 | 1.1% |
| December 2025 | 12 | 1,603 | 0.7% |
| January 2026 | 16 | 1,739 | 0.9% |
| February 2026 | 18 | 1,607 | 1.1% |
| March 2026 | 20 | 1,843 | 1.1% |
| April 2026 | 20 | 1,725 | 1.2% |
| May 2026 | 13 | 1,797 | 0.7% |
| June 2026 | 14 | 1,697 | 0.8% |
| July 2026 | 15 | 1,733 | 0.9% |
| August 2026 | 12 | 1,557 | 0.8% |
| September 2026 | 11 | 1,777 | 0.6% |
Seasonal comparisons — matched periods
| Period | Appointments / qualifying | Share | Last year | Change |
|---|---|---|---|---|
| June 2025–August 2025 | 36 / 4,855 | 0.7% | June 2024–August 2024: Unavailable / Unavailable (Unavailable) | — |
| September 2025–November 2025 | 42 / 4,515 | 0.9% | September 2024–November 2024: Unavailable / Unavailable (Unavailable) | — |
| December 2025–February 2026 | 46 / 4,949 | 0.9% | December 2024–February 2025: Unavailable / Unavailable (Unavailable) | — |
| March 2026–May 2026 | 53 / 5,365 | 1.0% | March 2025–May 2025: Unavailable / Unavailable (Unavailable) | — |
| June 2026–August 2026 | 41 / 4,987 | 0.8% | June 2025–August 2025: 36 / 4,855 (0.7%) | +0.1 pp |
| September 2026 | 11 / 1,777 | 0.6% | September 2025: 10 / 1,560 (0.6%) | 0.0 pp |
COPDView figures and history 0.3% 0.1% 0.3%0.0% last year
COPD
Chronic obstructive pulmonary disease (COPD) discussed or reviewed.
5 of 1,777 qualifying appointments addressed this concern.
Trailing 12 months: 16 appointments (0.1%) of 20,033.
Exact monthly figures — all saved history
| Month | Topic appointments | Qualifying appointments | Share |
|---|---|---|---|
| June 2025 | 1 | 1,787 | 0.1% |
| July 2025 | 1 | 1,617 | 0.1% |
| August 2025 | 1 | 1,451 | 0.1% |
| September 2025 | 0 | 1,560 | 0.0% |
| October 2025 | 0 | 1,450 | 0.0% |
| November 2025 | 0 | 1,505 | 0.0% |
| December 2025 | 0 | 1,603 | 0.0% |
| January 2026 | 2 | 1,739 | 0.1% |
| February 2026 | 1 | 1,607 | 0.1% |
| March 2026 | 3 | 1,843 | 0.2% |
| April 2026 | 0 | 1,725 | 0.0% |
| May 2026 | 1 | 1,797 | 0.1% |
| June 2026 | 3 | 1,697 | 0.2% |
| July 2026 | 0 | 1,733 | 0.0% |
| August 2026 | 1 | 1,557 | 0.1% |
| September 2026 | 5 | 1,777 | 0.3% |
Seasonal comparisons — matched periods
| Period | Appointments / qualifying | Share | Last year | Change |
|---|---|---|---|---|
| June 2025–August 2025 | 3 / 4,855 | 0.1% | June 2024–August 2024: Unavailable / Unavailable (Unavailable) | — |
| September 2025–November 2025 | 0 / 4,515 | 0.0% | September 2024–November 2024: Unavailable / Unavailable (Unavailable) | — |
| December 2025–February 2026 | 3 / 4,949 | 0.1% | December 2024–February 2025: Unavailable / Unavailable (Unavailable) | — |
| March 2026–May 2026 | 4 / 5,365 | 0.1% | March 2025–May 2025: Unavailable / Unavailable (Unavailable) | — |
| June 2026–August 2026 | 4 / 4,987 | 0.1% | June 2025–August 2025: 3 / 4,855 (0.1%) | 0.0 pp |
| September 2026 | 5 / 1,777 | 0.3% | September 2025: 0 / 1,560 (0.0%) | +0.3 pp |
View trends
Lung & breathing
Asthma, COPD, persistent cough, breathlessness and other lung or breathing concerns.
81 of 1,777 qualifying appointments addressed this concern.
Trailing 12 months: 895 appointments (4.5%) of 20,033.
Exact monthly figures — all saved history
| Month | Topic appointments | Qualifying appointments | Share |
|---|---|---|---|
| June 2025 | 58 | 1,787 | 3.2% |
| July 2025 | 47 | 1,617 | 2.9% |
| August 2025 | 53 | 1,451 | 3.7% |
| September 2025 | 63 | 1,560 | 4.0% |
| October 2025 | 85 | 1,450 | 5.9% |
| November 2025 | 66 | 1,505 | 4.4% |
| December 2025 | 79 | 1,603 | 4.9% |
| January 2026 | 80 | 1,739 | 4.6% |
| February 2026 | 69 | 1,607 | 4.3% |
| March 2026 | 95 | 1,843 | 5.2% |
| April 2026 | 71 | 1,725 | 4.1% |
| May 2026 | 76 | 1,797 | 4.2% |
| June 2026 | 80 | 1,697 | 4.7% |
| July 2026 | 67 | 1,733 | 3.9% |
| August 2026 | 46 | 1,557 | 3.0% |
| September 2026 | 81 | 1,777 | 4.6% |
Seasonal comparisons — matched periods
| Period | Appointments / qualifying | Share | Last year | Change |
|---|---|---|---|---|
| June 2025–August 2025 | 158 / 4,855 | 3.3% | June 2024–August 2024: Unavailable / Unavailable (Unavailable) | — |
| September 2025–November 2025 | 214 / 4,515 | 4.7% | September 2024–November 2024: Unavailable / Unavailable (Unavailable) | — |
| December 2025–February 2026 | 228 / 4,949 | 4.6% | December 2024–February 2025: Unavailable / Unavailable (Unavailable) | — |
| March 2026–May 2026 | 242 / 5,365 | 4.5% | March 2025–May 2025: Unavailable / Unavailable (Unavailable) | — |
| June 2026–August 2026 | 193 / 4,987 | 3.9% | June 2025–August 2025: 158 / 4,855 (3.3%) | +0.6 pp |
| September 2026 | 81 / 1,777 | 4.6% | September 2025: 63 / 1,560 (4.0%) | +0.5 pp |
Sexual healthShow 6 topics Hide topics 4.6% 4.6% 4.6%4.9% last year
STI symptoms or exposureView figures and history 2.8% 2.3% 2.8%2.5% last year
STI symptoms or exposure
Symptoms or exposure concerns relating to sexually transmitted infections (STIs).
50 of 1,777 qualifying appointments addressed this concern.
Trailing 12 months: 470 appointments (2.3%) of 20,033.
Exact monthly figures — all saved history
| Month | Topic appointments | Qualifying appointments | Share |
|---|---|---|---|
| June 2025 | 36 | 1,787 | 2.0% |
| July 2025 | 35 | 1,617 | 2.2% |
| August 2025 | 38 | 1,451 | 2.6% |
| September 2025 | 39 | 1,560 | 2.5% |
| October 2025 | 45 | 1,450 | 3.1% |
| November 2025 | 48 | 1,505 | 3.2% |
| December 2025 | 38 | 1,603 | 2.4% |
| January 2026 | 30 | 1,739 | 1.7% |
| February 2026 | 30 | 1,607 | 1.9% |
| March 2026 | 34 | 1,843 | 1.8% |
| April 2026 | 32 | 1,725 | 1.9% |
| May 2026 | 43 | 1,797 | 2.4% |
| June 2026 | 52 | 1,697 | 3.1% |
| July 2026 | 34 | 1,733 | 2.0% |
| August 2026 | 34 | 1,557 | 2.2% |
| September 2026 | 50 | 1,777 | 2.8% |
Seasonal comparisons — matched periods
| Period | Appointments / qualifying | Share | Last year | Change |
|---|---|---|---|---|
| June 2025–August 2025 | 109 / 4,855 | 2.2% | June 2024–August 2024: Unavailable / Unavailable (Unavailable) | — |
| September 2025–November 2025 | 132 / 4,515 | 2.9% | September 2024–November 2024: Unavailable / Unavailable (Unavailable) | — |
| December 2025–February 2026 | 98 / 4,949 | 2.0% | December 2024–February 2025: Unavailable / Unavailable (Unavailable) | — |
| March 2026–May 2026 | 109 / 5,365 | 2.0% | March 2025–May 2025: Unavailable / Unavailable (Unavailable) | — |
| June 2026–August 2026 | 120 / 4,987 | 2.4% | June 2025–August 2025: 109 / 4,855 (2.2%) | +0.2 pp |
| September 2026 | 50 / 1,777 | 2.8% | September 2025: 39 / 1,560 (2.5%) | +0.3 pp |
Sexual health testingView figures and history 1.1% 1.4% 1.1%1.3% last year
Sexual health testing
Sexual health testing relating to a clinical concern or exposure.
20 of 1,777 qualifying appointments addressed this concern.
Trailing 12 months: 273 appointments (1.4%) of 20,033.
Exact monthly figures — all saved history
| Month | Topic appointments | Qualifying appointments | Share |
|---|---|---|---|
| June 2025 | 34 | 1,787 | 1.9% |
| July 2025 | 28 | 1,617 | 1.7% |
| August 2025 | 23 | 1,451 | 1.6% |
| September 2025 | 20 | 1,560 | 1.3% |
| October 2025 | 26 | 1,450 | 1.8% |
| November 2025 | 32 | 1,505 | 2.1% |
| December 2025 | 19 | 1,603 | 1.2% |
| January 2026 | 28 | 1,739 | 1.6% |
| February 2026 | 17 | 1,607 | 1.1% |
| March 2026 | 16 | 1,843 | 0.9% |
| April 2026 | 18 | 1,725 | 1.0% |
| May 2026 | 22 | 1,797 | 1.2% |
| June 2026 | 26 | 1,697 | 1.5% |
| July 2026 | 29 | 1,733 | 1.7% |
| August 2026 | 20 | 1,557 | 1.3% |
| September 2026 | 20 | 1,777 | 1.1% |
Seasonal comparisons — matched periods
| Period | Appointments / qualifying | Share | Last year | Change |
|---|---|---|---|---|
| June 2025–August 2025 | 85 / 4,855 | 1.8% | June 2024–August 2024: Unavailable / Unavailable (Unavailable) | — |
| September 2025–November 2025 | 78 / 4,515 | 1.7% | September 2024–November 2024: Unavailable / Unavailable (Unavailable) | — |
| December 2025–February 2026 | 64 / 4,949 | 1.3% | December 2024–February 2025: Unavailable / Unavailable (Unavailable) | — |
| March 2026–May 2026 | 56 / 5,365 | 1.0% | March 2025–May 2025: Unavailable / Unavailable (Unavailable) | — |
| June 2026–August 2026 | 75 / 4,987 | 1.5% | June 2025–August 2025: 85 / 4,855 (1.8%) | -0.2 pp |
| September 2026 | 20 / 1,777 | 1.1% | September 2025: 20 / 1,560 (1.3%) | -0.2 pp |
Diagnosed or specifically suspected STIsShow 6 topics Hide topics 0.8% 1.1% 0.8%1.3% last year
Genital herpesView figures and history 0.3% 0.5% 0.3%0.6% last year
Genital herpes
Genital herpes specifically discussed or assessed, including suspected infection.
5 of 1,777 qualifying appointments addressed this concern.
Trailing 12 months: 107 appointments (0.5%) of 20,033.
Exact monthly figures — all saved history
| Month | Topic appointments | Qualifying appointments | Share |
|---|---|---|---|
| June 2025 | 18 | 1,787 | 1.0% |
| July 2025 | 20 | 1,617 | 1.2% |
| August 2025 | 8 | 1,451 | 0.6% |
| September 2025 | 10 | 1,560 | 0.6% |
| October 2025 | 13 | 1,450 | 0.9% |
| November 2025 | 11 | 1,505 | 0.7% |
| December 2025 | 7 | 1,603 | 0.4% |
| January 2026 | 10 | 1,739 | 0.6% |
| February 2026 | 11 | 1,607 | 0.7% |
| March 2026 | 4 | 1,843 | 0.2% |
| April 2026 | 11 | 1,725 | 0.6% |
| May 2026 | 8 | 1,797 | 0.4% |
| June 2026 | 14 | 1,697 | 0.8% |
| July 2026 | 7 | 1,733 | 0.4% |
| August 2026 | 6 | 1,557 | 0.4% |
| September 2026 | 5 | 1,777 | 0.3% |
Seasonal comparisons — matched periods
| Period | Appointments / qualifying | Share | Last year | Change |
|---|---|---|---|---|
| June 2025–August 2025 | 46 / 4,855 | 0.9% | June 2024–August 2024: Unavailable / Unavailable (Unavailable) | — |
| September 2025–November 2025 | 34 / 4,515 | 0.8% | September 2024–November 2024: Unavailable / Unavailable (Unavailable) | — |
| December 2025–February 2026 | 28 / 4,949 | 0.6% | December 2024–February 2025: Unavailable / Unavailable (Unavailable) | — |
| March 2026–May 2026 | 23 / 5,365 | 0.4% | March 2025–May 2025: Unavailable / Unavailable (Unavailable) | — |
| June 2026–August 2026 | 27 / 4,987 | 0.5% | June 2025–August 2025: 46 / 4,855 (0.9%) | -0.4 pp |
| September 2026 | 5 / 1,777 | 0.3% | September 2025: 10 / 1,560 (0.6%) | -0.4 pp |
Genital wartsView figures and history 0.3% 0.3% 0.3%0.1% last year
Genital warts
Genital warts specifically discussed or assessed.
5 of 1,777 qualifying appointments addressed this concern.
Trailing 12 months: 56 appointments (0.3%) of 20,033.
Exact monthly figures — all saved history
| Month | Topic appointments | Qualifying appointments | Share |
|---|---|---|---|
| June 2025 | 4 | 1,787 | 0.2% |
| July 2025 | 5 | 1,617 | 0.3% |
| August 2025 | 4 | 1,451 | 0.3% |
| September 2025 | 2 | 1,560 | 0.1% |
| October 2025 | 7 | 1,450 | 0.5% |
| November 2025 | 5 | 1,505 | 0.3% |
| December 2025 | 3 | 1,603 | 0.2% |
| January 2026 | 2 | 1,739 | 0.1% |
| February 2026 | 6 | 1,607 | 0.4% |
| March 2026 | 4 | 1,843 | 0.2% |
| April 2026 | 4 | 1,725 | 0.2% |
| May 2026 | 3 | 1,797 | 0.2% |
| June 2026 | 5 | 1,697 | 0.3% |
| July 2026 | 7 | 1,733 | 0.4% |
| August 2026 | 5 | 1,557 | 0.3% |
| September 2026 | 5 | 1,777 | 0.3% |
Seasonal comparisons — matched periods
| Period | Appointments / qualifying | Share | Last year | Change |
|---|---|---|---|---|
| June 2025–August 2025 | 13 / 4,855 | 0.3% | June 2024–August 2024: Unavailable / Unavailable (Unavailable) | — |
| September 2025–November 2025 | 14 / 4,515 | 0.3% | September 2024–November 2024: Unavailable / Unavailable (Unavailable) | — |
| December 2025–February 2026 | 11 / 4,949 | 0.2% | December 2024–February 2025: Unavailable / Unavailable (Unavailable) | — |
| March 2026–May 2026 | 11 / 5,365 | 0.2% | March 2025–May 2025: Unavailable / Unavailable (Unavailable) | — |
| June 2026–August 2026 | 17 / 4,987 | 0.3% | June 2025–August 2025: 13 / 4,855 (0.3%) | +0.1 pp |
| September 2026 | 5 / 1,777 | 0.3% | September 2025: 2 / 1,560 (0.1%) | +0.2 pp |
Other STIsView figures and history 0.1% 0.2% 0.1%0.3% last year
Other STIs
Other named sexually transmitted infections diagnosed or specifically suspected.
2 of 1,777 qualifying appointments addressed this concern.
Trailing 12 months: 32 appointments (0.2%) of 20,033.
Exact monthly figures — all saved history
| Month | Topic appointments | Qualifying appointments | Share |
|---|---|---|---|
| June 2025 | 4 | 1,787 | 0.2% |
| July 2025 | 5 | 1,617 | 0.3% |
| August 2025 | 2 | 1,451 | 0.1% |
| September 2025 | 4 | 1,560 | 0.3% |
| October 2025 | 3 | 1,450 | 0.2% |
| November 2025 | 3 | 1,505 | 0.2% |
| December 2025 | 5 | 1,603 | 0.3% |
| January 2026 | 3 | 1,739 | 0.2% |
| February 2026 | 4 | 1,607 | 0.2% |
| March 2026 | 0 | 1,843 | 0.0% |
| April 2026 | 3 | 1,725 | 0.2% |
| May 2026 | 2 | 1,797 | 0.1% |
| June 2026 | 2 | 1,697 | 0.1% |
| July 2026 | 5 | 1,733 | 0.3% |
| August 2026 | 0 | 1,557 | 0.0% |
| September 2026 | 2 | 1,777 | 0.1% |
Seasonal comparisons — matched periods
| Period | Appointments / qualifying | Share | Last year | Change |
|---|---|---|---|---|
| June 2025–August 2025 | 11 / 4,855 | 0.2% | June 2024–August 2024: Unavailable / Unavailable (Unavailable) | — |
| September 2025–November 2025 | 10 / 4,515 | 0.2% | September 2024–November 2024: Unavailable / Unavailable (Unavailable) | — |
| December 2025–February 2026 | 12 / 4,949 | 0.2% | December 2024–February 2025: Unavailable / Unavailable (Unavailable) | — |
| March 2026–May 2026 | 5 / 5,365 | 0.1% | March 2025–May 2025: Unavailable / Unavailable (Unavailable) | — |
| June 2026–August 2026 | 7 / 4,987 | 0.1% | June 2025–August 2025: 11 / 4,855 (0.2%) | -0.1 pp |
| September 2026 | 2 / 1,777 | 0.1% | September 2025: 4 / 1,560 (0.3%) | -0.1 pp |
ChlamydiaView figures and history 0.1% 0.1% 0.1%0.1% last year
Chlamydia
Chlamydia diagnosed or specifically suspected and addressed at the appointment.
1 of 1,777 qualifying appointments addressed this concern.
Trailing 12 months: 11 appointments (0.1%) of 20,033.
Exact monthly figures — all saved history
| Month | Topic appointments | Qualifying appointments | Share |
|---|---|---|---|
| June 2025 | 1 | 1,787 | 0.1% |
| July 2025 | 0 | 1,617 | 0.0% |
| August 2025 | 2 | 1,451 | 0.1% |
| September 2025 | 1 | 1,560 | 0.1% |
| October 2025 | 0 | 1,450 | 0.0% |
| November 2025 | 2 | 1,505 | 0.1% |
| December 2025 | 1 | 1,603 | 0.1% |
| January 2026 | 1 | 1,739 | 0.1% |
| February 2026 | 1 | 1,607 | 0.1% |
| March 2026 | 0 | 1,843 | 0.0% |
| April 2026 | 2 | 1,725 | 0.1% |
| May 2026 | 0 | 1,797 | 0.0% |
| June 2026 | 1 | 1,697 | 0.1% |
| July 2026 | 0 | 1,733 | 0.0% |
| August 2026 | 2 | 1,557 | 0.1% |
| September 2026 | 1 | 1,777 | 0.1% |
Seasonal comparisons — matched periods
| Period | Appointments / qualifying | Share | Last year | Change |
|---|---|---|---|---|
| June 2025–August 2025 | 3 / 4,855 | 0.1% | June 2024–August 2024: Unavailable / Unavailable (Unavailable) | — |
| September 2025–November 2025 | 3 / 4,515 | 0.1% | September 2024–November 2024: Unavailable / Unavailable (Unavailable) | — |
| December 2025–February 2026 | 3 / 4,949 | 0.1% | December 2024–February 2025: Unavailable / Unavailable (Unavailable) | — |
| March 2026–May 2026 | 2 / 5,365 | 0.0% | March 2025–May 2025: Unavailable / Unavailable (Unavailable) | — |
| June 2026–August 2026 | 3 / 4,987 | 0.1% | June 2025–August 2025: 3 / 4,855 (0.1%) | 0.0 pp |
| September 2026 | 1 / 1,777 | 0.1% | September 2025: 1 / 1,560 (0.1%) | 0.0 pp |
GonorrhoeaView figures and history 0.1% 0.1% 0.1%0.1% last year
Gonorrhoea
Gonorrhoea diagnosed or specifically suspected and addressed at the appointment.
1 of 1,777 qualifying appointments addressed this concern.
Trailing 12 months: 16 appointments (0.1%) of 20,033.
Exact monthly figures — all saved history
| Month | Topic appointments | Qualifying appointments | Share |
|---|---|---|---|
| June 2025 | 0 | 1,787 | 0.0% |
| July 2025 | 2 | 1,617 | 0.1% |
| August 2025 | 1 | 1,451 | 0.1% |
| September 2025 | 2 | 1,560 | 0.1% |
| October 2025 | 1 | 1,450 | 0.1% |
| November 2025 | 1 | 1,505 | 0.1% |
| December 2025 | 0 | 1,603 | 0.0% |
| January 2026 | 3 | 1,739 | 0.2% |
| February 2026 | 1 | 1,607 | 0.1% |
| March 2026 | 3 | 1,843 | 0.2% |
| April 2026 | 2 | 1,725 | 0.1% |
| May 2026 | 3 | 1,797 | 0.2% |
| June 2026 | 0 | 1,697 | 0.0% |
| July 2026 | 1 | 1,733 | 0.1% |
| August 2026 | 0 | 1,557 | 0.0% |
| September 2026 | 1 | 1,777 | 0.1% |
Seasonal comparisons — matched periods
| Period | Appointments / qualifying | Share | Last year | Change |
|---|---|---|---|---|
| June 2025–August 2025 | 3 / 4,855 | 0.1% | June 2024–August 2024: Unavailable / Unavailable (Unavailable) | — |
| September 2025–November 2025 | 4 / 4,515 | 0.1% | September 2024–November 2024: Unavailable / Unavailable (Unavailable) | — |
| December 2025–February 2026 | 4 / 4,949 | 0.1% | December 2024–February 2025: Unavailable / Unavailable (Unavailable) | — |
| March 2026–May 2026 | 8 / 5,365 | 0.1% | March 2025–May 2025: Unavailable / Unavailable (Unavailable) | — |
| June 2026–August 2026 | 1 / 4,987 | 0.0% | June 2025–August 2025: 3 / 4,855 (0.1%) | 0.0 pp |
| September 2026 | 1 / 1,777 | 0.1% | September 2025: 2 / 1,560 (0.1%) | -0.1 pp |
SyphilisView figures and history 0.0% 0.0% 0.0%0.1% last year
Syphilis
Syphilis diagnosed or specifically suspected and addressed at the appointment.
0 of 1,777 qualifying appointments addressed this concern.
Trailing 12 months: 9 appointments (0.0%) of 20,033.
Exact monthly figures — all saved history
| Month | Topic appointments | Qualifying appointments | Share |
|---|---|---|---|
| June 2025 | 0 | 1,787 | 0.0% |
| July 2025 | 2 | 1,617 | 0.1% |
| August 2025 | 3 | 1,451 | 0.2% |
| September 2025 | 1 | 1,560 | 0.1% |
| October 2025 | 0 | 1,450 | 0.0% |
| November 2025 | 1 | 1,505 | 0.1% |
| December 2025 | 2 | 1,603 | 0.1% |
| January 2026 | 1 | 1,739 | 0.1% |
| February 2026 | 1 | 1,607 | 0.1% |
| March 2026 | 0 | 1,843 | 0.0% |
| April 2026 | 1 | 1,725 | 0.1% |
| May 2026 | 2 | 1,797 | 0.1% |
| June 2026 | 0 | 1,697 | 0.0% |
| July 2026 | 0 | 1,733 | 0.0% |
| August 2026 | 1 | 1,557 | 0.1% |
| September 2026 | 0 | 1,777 | 0.0% |
Seasonal comparisons — matched periods
| Period | Appointments / qualifying | Share | Last year | Change |
|---|---|---|---|---|
| June 2025–August 2025 | 5 / 4,855 | 0.1% | June 2024–August 2024: Unavailable / Unavailable (Unavailable) | — |
| September 2025–November 2025 | 2 / 4,515 | 0.0% | September 2024–November 2024: Unavailable / Unavailable (Unavailable) | — |
| December 2025–February 2026 | 4 / 4,949 | 0.1% | December 2024–February 2025: Unavailable / Unavailable (Unavailable) | — |
| March 2026–May 2026 | 3 / 5,365 | 0.1% | March 2025–May 2025: Unavailable / Unavailable (Unavailable) | — |
| June 2026–August 2026 | 1 / 4,987 | 0.0% | June 2025–August 2025: 5 / 4,855 (0.1%) | -0.1 pp |
| September 2026 | 0 / 1,777 | 0.0% | September 2025: 1 / 1,560 (0.1%) | -0.1 pp |
View trends
Diagnosed or specifically suspected STIs
Named sexually transmitted infections diagnosed or specifically suspected and addressed. Counts include suspected infections.
14 of 1,777 qualifying appointments addressed this concern.
Trailing 12 months: 227 appointments (1.1%) of 20,033.
Exact monthly figures — all saved history
| Month | Topic appointments | Qualifying appointments | Share |
|---|---|---|---|
| June 2025 | 26 | 1,787 | 1.5% |
| July 2025 | 33 | 1,617 | 2.0% |
| August 2025 | 17 | 1,451 | 1.2% |
| September 2025 | 20 | 1,560 | 1.3% |
| October 2025 | 24 | 1,450 | 1.7% |
| November 2025 | 23 | 1,505 | 1.5% |
| December 2025 | 17 | 1,603 | 1.1% |
| January 2026 | 20 | 1,739 | 1.2% |
| February 2026 | 23 | 1,607 | 1.4% |
| March 2026 | 11 | 1,843 | 0.6% |
| April 2026 | 22 | 1,725 | 1.3% |
| May 2026 | 17 | 1,797 | 0.9% |
| June 2026 | 22 | 1,697 | 1.3% |
| July 2026 | 20 | 1,733 | 1.2% |
| August 2026 | 14 | 1,557 | 0.9% |
| September 2026 | 14 | 1,777 | 0.8% |
Seasonal comparisons — matched periods
| Period | Appointments / qualifying | Share | Last year | Change |
|---|---|---|---|---|
| June 2025–August 2025 | 76 / 4,855 | 1.6% | June 2024–August 2024: Unavailable / Unavailable (Unavailable) | — |
| September 2025–November 2025 | 67 / 4,515 | 1.5% | September 2024–November 2024: Unavailable / Unavailable (Unavailable) | — |
| December 2025–February 2026 | 60 / 4,949 | 1.2% | December 2024–February 2025: Unavailable / Unavailable (Unavailable) | — |
| March 2026–May 2026 | 50 / 5,365 | 0.9% | March 2025–May 2025: Unavailable / Unavailable (Unavailable) | — |
| June 2026–August 2026 | 56 / 4,987 | 1.1% | June 2025–August 2025: 76 / 4,855 (1.6%) | -0.4 pp |
| September 2026 | 14 / 1,777 | 0.8% | September 2025: 20 / 1,560 (1.3%) | -0.5 pp |
PrEP & PEPShow 2 topics Hide topics 0.1% 0.1% 0.1%0.1% last year
PEPView figures and history 0.1% 0.0% 0.1%0.1% last year
PEP
HIV post-exposure prophylaxis (PEP) concerns within qualifying appointments.
1 of 1,777 qualifying appointments addressed this concern.
Trailing 12 months: 6 appointments (0.0%) of 20,033.
Exact monthly figures — all saved history
| Month | Topic appointments | Qualifying appointments | Share |
|---|---|---|---|
| June 2025 | 1 | 1,787 | 0.1% |
| July 2025 | 0 | 1,617 | 0.0% |
| August 2025 | 1 | 1,451 | 0.1% |
| September 2025 | 1 | 1,560 | 0.1% |
| October 2025 | 0 | 1,450 | 0.0% |
| November 2025 | 0 | 1,505 | 0.0% |
| December 2025 | 0 | 1,603 | 0.0% |
| January 2026 | 0 | 1,739 | 0.0% |
| February 2026 | 0 | 1,607 | 0.0% |
| March 2026 | 1 | 1,843 | 0.1% |
| April 2026 | 0 | 1,725 | 0.0% |
| May 2026 | 2 | 1,797 | 0.1% |
| June 2026 | 1 | 1,697 | 0.1% |
| July 2026 | 0 | 1,733 | 0.0% |
| August 2026 | 1 | 1,557 | 0.1% |
| September 2026 | 1 | 1,777 | 0.1% |
Seasonal comparisons — matched periods
| Period | Appointments / qualifying | Share | Last year | Change |
|---|---|---|---|---|
| June 2025–August 2025 | 2 / 4,855 | 0.0% | June 2024–August 2024: Unavailable / Unavailable (Unavailable) | — |
| September 2025–November 2025 | 1 / 4,515 | 0.0% | September 2024–November 2024: Unavailable / Unavailable (Unavailable) | — |
| December 2025–February 2026 | 0 / 4,949 | 0.0% | December 2024–February 2025: Unavailable / Unavailable (Unavailable) | — |
| March 2026–May 2026 | 3 / 5,365 | 0.1% | March 2025–May 2025: Unavailable / Unavailable (Unavailable) | — |
| June 2026–August 2026 | 2 / 4,987 | 0.0% | June 2025–August 2025: 2 / 4,855 (0.0%) | 0.0 pp |
| September 2026 | 1 / 1,777 | 0.1% | September 2025: 1 / 1,560 (0.1%) | 0.0 pp |
PrEPView figures and history 0.0% 0.0% 0.0%0.0% last year
PrEP
HIV pre-exposure prophylaxis (PrEP) concerns within qualifying appointments.
0 of 1,777 qualifying appointments addressed this concern.
Trailing 12 months: 6 appointments (0.0%) of 20,033.
Exact monthly figures — all saved history
| Month | Topic appointments | Qualifying appointments | Share |
|---|---|---|---|
| June 2025 | 2 | 1,787 | 0.1% |
| July 2025 | 0 | 1,617 | 0.0% |
| August 2025 | 1 | 1,451 | 0.1% |
| September 2025 | 0 | 1,560 | 0.0% |
| October 2025 | 0 | 1,450 | 0.0% |
| November 2025 | 1 | 1,505 | 0.1% |
| December 2025 | 1 | 1,603 | 0.1% |
| January 2026 | 0 | 1,739 | 0.0% |
| February 2026 | 0 | 1,607 | 0.0% |
| March 2026 | 0 | 1,843 | 0.0% |
| April 2026 | 1 | 1,725 | 0.1% |
| May 2026 | 0 | 1,797 | 0.0% |
| June 2026 | 1 | 1,697 | 0.1% |
| July 2026 | 2 | 1,733 | 0.1% |
| August 2026 | 0 | 1,557 | 0.0% |
| September 2026 | 0 | 1,777 | 0.0% |
Seasonal comparisons — matched periods
| Period | Appointments / qualifying | Share | Last year | Change |
|---|---|---|---|---|
| June 2025–August 2025 | 3 / 4,855 | 0.1% | June 2024–August 2024: Unavailable / Unavailable (Unavailable) | — |
| September 2025–November 2025 | 1 / 4,515 | 0.0% | September 2024–November 2024: Unavailable / Unavailable (Unavailable) | — |
| December 2025–February 2026 | 1 / 4,949 | 0.0% | December 2024–February 2025: Unavailable / Unavailable (Unavailable) | — |
| March 2026–May 2026 | 1 / 5,365 | 0.0% | March 2025–May 2025: Unavailable / Unavailable (Unavailable) | — |
| June 2026–August 2026 | 3 / 4,987 | 0.1% | June 2025–August 2025: 3 / 4,855 (0.1%) | 0.0 pp |
| September 2026 | 0 / 1,777 | 0.0% | September 2025: 0 / 1,560 (0.0%) | 0.0 pp |
View trends
PrEP & PEP
HIV pre-exposure prophylaxis (PrEP) and post-exposure prophylaxis (PEP) concerns within qualifying appointments.
1 of 1,777 qualifying appointments addressed this concern.
Trailing 12 months: 11 appointments (0.1%) of 20,033.
Exact monthly figures — all saved history
| Month | Topic appointments | Qualifying appointments | Share |
|---|---|---|---|
| June 2025 | 3 | 1,787 | 0.2% |
| July 2025 | 0 | 1,617 | 0.0% |
| August 2025 | 2 | 1,451 | 0.1% |
| September 2025 | 1 | 1,560 | 0.1% |
| October 2025 | 0 | 1,450 | 0.0% |
| November 2025 | 1 | 1,505 | 0.1% |
| December 2025 | 1 | 1,603 | 0.1% |
| January 2026 | 0 | 1,739 | 0.0% |
| February 2026 | 0 | 1,607 | 0.0% |
| March 2026 | 1 | 1,843 | 0.1% |
| April 2026 | 1 | 1,725 | 0.1% |
| May 2026 | 2 | 1,797 | 0.1% |
| June 2026 | 1 | 1,697 | 0.1% |
| July 2026 | 2 | 1,733 | 0.1% |
| August 2026 | 1 | 1,557 | 0.1% |
| September 2026 | 1 | 1,777 | 0.1% |
Seasonal comparisons — matched periods
| Period | Appointments / qualifying | Share | Last year | Change |
|---|---|---|---|---|
| June 2025–August 2025 | 5 / 4,855 | 0.1% | June 2024–August 2024: Unavailable / Unavailable (Unavailable) | — |
| September 2025–November 2025 | 2 / 4,515 | 0.0% | September 2024–November 2024: Unavailable / Unavailable (Unavailable) | — |
| December 2025–February 2026 | 1 / 4,949 | 0.0% | December 2024–February 2025: Unavailable / Unavailable (Unavailable) | — |
| March 2026–May 2026 | 4 / 5,365 | 0.1% | March 2025–May 2025: Unavailable / Unavailable (Unavailable) | — |
| June 2026–August 2026 | 4 / 4,987 | 0.1% | June 2025–August 2025: 5 / 4,855 (0.1%) | 0.0 pp |
| September 2026 | 1 / 1,777 | 0.1% | September 2025: 1 / 1,560 (0.1%) | 0.0 pp |
Other sexual health concernsView figures and history 0.1% 0.1% 0.1%0.1% last year
Other sexual health concerns
Other sexual health concerns without a more specific recorded category.
1 of 1,777 qualifying appointments addressed this concern.
Trailing 12 months: 19 appointments (0.1%) of 20,033.
Exact monthly figures — all saved history
| Month | Topic appointments | Qualifying appointments | Share |
|---|---|---|---|
| June 2025 | 1 | 1,787 | 0.1% |
| July 2025 | 1 | 1,617 | 0.1% |
| August 2025 | 1 | 1,451 | 0.1% |
| September 2025 | 1 | 1,560 | 0.1% |
| October 2025 | 2 | 1,450 | 0.1% |
| November 2025 | 1 | 1,505 | 0.1% |
| December 2025 | 2 | 1,603 | 0.1% |
| January 2026 | 3 | 1,739 | 0.2% |
| February 2026 | 1 | 1,607 | 0.1% |
| March 2026 | 0 | 1,843 | 0.0% |
| April 2026 | 1 | 1,725 | 0.1% |
| May 2026 | 4 | 1,797 | 0.2% |
| June 2026 | 1 | 1,697 | 0.1% |
| July 2026 | 2 | 1,733 | 0.1% |
| August 2026 | 1 | 1,557 | 0.1% |
| September 2026 | 1 | 1,777 | 0.1% |
Seasonal comparisons — matched periods
| Period | Appointments / qualifying | Share | Last year | Change |
|---|---|---|---|---|
| June 2025–August 2025 | 3 / 4,855 | 0.1% | June 2024–August 2024: Unavailable / Unavailable (Unavailable) | — |
| September 2025–November 2025 | 4 / 4,515 | 0.1% | September 2024–November 2024: Unavailable / Unavailable (Unavailable) | — |
| December 2025–February 2026 | 6 / 4,949 | 0.1% | December 2024–February 2025: Unavailable / Unavailable (Unavailable) | — |
| March 2026–May 2026 | 5 / 5,365 | 0.1% | March 2025–May 2025: Unavailable / Unavailable (Unavailable) | — |
| June 2026–August 2026 | 4 / 4,987 | 0.1% | June 2025–August 2025: 3 / 4,855 (0.1%) | 0.0 pp |
| September 2026 | 1 / 1,777 | 0.1% | September 2025: 1 / 1,560 (0.1%) | 0.0 pp |
HIV-related concernsView figures and history 0.0% 0.1% 0.0%0.1% last year
HIV-related concerns
HIV-related concerns, including assessment, treatment and review.
0 of 1,777 qualifying appointments addressed this concern.
Trailing 12 months: 11 appointments (0.1%) of 20,033.
Exact monthly figures — all saved history
| Month | Topic appointments | Qualifying appointments | Share |
|---|---|---|---|
| June 2025 | 1 | 1,787 | 0.1% |
| July 2025 | 1 | 1,617 | 0.1% |
| August 2025 | 1 | 1,451 | 0.1% |
| September 2025 | 1 | 1,560 | 0.1% |
| October 2025 | 1 | 1,450 | 0.1% |
| November 2025 | 0 | 1,505 | 0.0% |
| December 2025 | 4 | 1,603 | 0.2% |
| January 2026 | 1 | 1,739 | 0.1% |
| February 2026 | 2 | 1,607 | 0.1% |
| March 2026 | 1 | 1,843 | 0.1% |
| April 2026 | 1 | 1,725 | 0.1% |
| May 2026 | 0 | 1,797 | 0.0% |
| June 2026 | 0 | 1,697 | 0.0% |
| July 2026 | 1 | 1,733 | 0.1% |
| August 2026 | 0 | 1,557 | 0.0% |
| September 2026 | 0 | 1,777 | 0.0% |
Seasonal comparisons — matched periods
| Period | Appointments / qualifying | Share | Last year | Change |
|---|---|---|---|---|
| June 2025–August 2025 | 3 / 4,855 | 0.1% | June 2024–August 2024: Unavailable / Unavailable (Unavailable) | — |
| September 2025–November 2025 | 2 / 4,515 | 0.0% | September 2024–November 2024: Unavailable / Unavailable (Unavailable) | — |
| December 2025–February 2026 | 7 / 4,949 | 0.1% | December 2024–February 2025: Unavailable / Unavailable (Unavailable) | — |
| March 2026–May 2026 | 2 / 5,365 | 0.0% | March 2025–May 2025: Unavailable / Unavailable (Unavailable) | — |
| June 2026–August 2026 | 1 / 4,987 | 0.0% | June 2025–August 2025: 3 / 4,855 (0.1%) | 0.0 pp |
| September 2026 | 0 / 1,777 | 0.0% | September 2025: 1 / 1,560 (0.1%) | -0.1 pp |
View trends
Sexual health
Sexual health symptoms, exposure, infections, testing and HIV prevention or care.
81 of 1,777 qualifying appointments addressed this concern.
Trailing 12 months: 921 appointments (4.6%) of 20,033.
Exact monthly figures — all saved history
| Month | Topic appointments | Qualifying appointments | Share |
|---|---|---|---|
| June 2025 | 96 | 1,787 | 5.4% |
| July 2025 | 93 | 1,617 | 5.8% |
| August 2025 | 78 | 1,451 | 5.4% |
| September 2025 | 76 | 1,560 | 4.9% |
| October 2025 | 92 | 1,450 | 6.3% |
| November 2025 | 95 | 1,505 | 6.3% |
| December 2025 | 73 | 1,603 | 4.6% |
| January 2026 | 71 | 1,739 | 4.1% |
| February 2026 | 67 | 1,607 | 4.2% |
| March 2026 | 60 | 1,843 | 3.3% |
| April 2026 | 66 | 1,725 | 3.8% |
| May 2026 | 78 | 1,797 | 4.3% |
| June 2026 | 94 | 1,697 | 5.5% |
| July 2026 | 78 | 1,733 | 4.5% |
| August 2026 | 66 | 1,557 | 4.2% |
| September 2026 | 81 | 1,777 | 4.6% |
Seasonal comparisons — matched periods
| Period | Appointments / qualifying | Share | Last year | Change |
|---|---|---|---|---|
| June 2025–August 2025 | 267 / 4,855 | 5.5% | June 2024–August 2024: Unavailable / Unavailable (Unavailable) | — |
| September 2025–November 2025 | 263 / 4,515 | 5.8% | September 2024–November 2024: Unavailable / Unavailable (Unavailable) | — |
| December 2025–February 2026 | 211 / 4,949 | 4.3% | December 2024–February 2025: Unavailable / Unavailable (Unavailable) | — |
| March 2026–May 2026 | 204 / 5,365 | 3.8% | March 2025–May 2025: Unavailable / Unavailable (Unavailable) | — |
| June 2026–August 2026 | 238 / 4,987 | 4.8% | June 2025–August 2025: 267 / 4,855 (5.5%) | -0.7 pp |
| September 2026 | 81 / 1,777 | 4.6% | September 2025: 76 / 1,560 (4.9%) | -0.3 pp |
Men's & urogenital healthShow 5 topics Hide topics 4.2% 3.8% 4.2%4.0% last year
Penile concernsShow 2 topics Hide topics 1.9% 1.6% 1.9%1.3% last year
BalanitisView figures and history 1.0% 0.9% 1.0%0.6% last year
Balanitis
Balanitis specifically discussed or assessed.
18 of 1,777 qualifying appointments addressed this concern.
Trailing 12 months: 171 appointments (0.9%) of 20,033.
Exact monthly figures — all saved history
| Month | Topic appointments | Qualifying appointments | Share |
|---|---|---|---|
| June 2025 | 22 | 1,787 | 1.2% |
| July 2025 | 7 | 1,617 | 0.4% |
| August 2025 | 20 | 1,451 | 1.4% |
| September 2025 | 10 | 1,560 | 0.6% |
| October 2025 | 21 | 1,450 | 1.4% |
| November 2025 | 18 | 1,505 | 1.2% |
| December 2025 | 16 | 1,603 | 1.0% |
| January 2026 | 11 | 1,739 | 0.6% |
| February 2026 | 7 | 1,607 | 0.4% |
| March 2026 | 12 | 1,843 | 0.7% |
| April 2026 | 11 | 1,725 | 0.6% |
| May 2026 | 12 | 1,797 | 0.7% |
| June 2026 | 19 | 1,697 | 1.1% |
| July 2026 | 11 | 1,733 | 0.6% |
| August 2026 | 15 | 1,557 | 1.0% |
| September 2026 | 18 | 1,777 | 1.0% |
Seasonal comparisons — matched periods
| Period | Appointments / qualifying | Share | Last year | Change |
|---|---|---|---|---|
| June 2025–August 2025 | 49 / 4,855 | 1.0% | June 2024–August 2024: Unavailable / Unavailable (Unavailable) | — |
| September 2025–November 2025 | 49 / 4,515 | 1.1% | September 2024–November 2024: Unavailable / Unavailable (Unavailable) | — |
| December 2025–February 2026 | 34 / 4,949 | 0.7% | December 2024–February 2025: Unavailable / Unavailable (Unavailable) | — |
| March 2026–May 2026 | 35 / 5,365 | 0.7% | March 2025–May 2025: Unavailable / Unavailable (Unavailable) | — |
| June 2026–August 2026 | 45 / 4,987 | 0.9% | June 2025–August 2025: 49 / 4,855 (1.0%) | -0.1 pp |
| September 2026 | 18 / 1,777 | 1.0% | September 2025: 10 / 1,560 (0.6%) | +0.4 pp |
Other penile concernsView figures and history 1.0% 0.7% 1.0%0.8% last year
Other penile concerns
Other penile symptoms or concerns.
18 of 1,777 qualifying appointments addressed this concern.
Trailing 12 months: 149 appointments (0.7%) of 20,033.
Exact monthly figures — all saved history
| Month | Topic appointments | Qualifying appointments | Share |
|---|---|---|---|
| June 2025 | 18 | 1,787 | 1.0% |
| July 2025 | 10 | 1,617 | 0.6% |
| August 2025 | 14 | 1,451 | 1.0% |
| September 2025 | 12 | 1,560 | 0.8% |
| October 2025 | 11 | 1,450 | 0.8% |
| November 2025 | 19 | 1,505 | 1.3% |
| December 2025 | 16 | 1,603 | 1.0% |
| January 2026 | 11 | 1,739 | 0.6% |
| February 2026 | 6 | 1,607 | 0.4% |
| March 2026 | 13 | 1,843 | 0.7% |
| April 2026 | 10 | 1,725 | 0.6% |
| May 2026 | 9 | 1,797 | 0.5% |
| June 2026 | 14 | 1,697 | 0.8% |
| July 2026 | 12 | 1,733 | 0.7% |
| August 2026 | 10 | 1,557 | 0.6% |
| September 2026 | 18 | 1,777 | 1.0% |
Seasonal comparisons — matched periods
| Period | Appointments / qualifying | Share | Last year | Change |
|---|---|---|---|---|
| June 2025–August 2025 | 42 / 4,855 | 0.9% | June 2024–August 2024: Unavailable / Unavailable (Unavailable) | — |
| September 2025–November 2025 | 42 / 4,515 | 0.9% | September 2024–November 2024: Unavailable / Unavailable (Unavailable) | — |
| December 2025–February 2026 | 33 / 4,949 | 0.7% | December 2024–February 2025: Unavailable / Unavailable (Unavailable) | — |
| March 2026–May 2026 | 32 / 5,365 | 0.6% | March 2025–May 2025: Unavailable / Unavailable (Unavailable) | — |
| June 2026–August 2026 | 36 / 4,987 | 0.7% | June 2025–August 2025: 42 / 4,855 (0.9%) | -0.1 pp |
| September 2026 | 18 / 1,777 | 1.0% | September 2025: 12 / 1,560 (0.8%) | +0.2 pp |
View trends
Penile concerns
Balanitis and other penile symptoms or concerns.
34 of 1,777 qualifying appointments addressed this concern.
Trailing 12 months: 313 appointments (1.6%) of 20,033.
Exact monthly figures — all saved history
| Month | Topic appointments | Qualifying appointments | Share |
|---|---|---|---|
| June 2025 | 39 | 1,787 | 2.2% |
| July 2025 | 17 | 1,617 | 1.1% |
| August 2025 | 34 | 1,451 | 2.3% |
| September 2025 | 21 | 1,560 | 1.3% |
| October 2025 | 30 | 1,450 | 2.1% |
| November 2025 | 36 | 1,505 | 2.4% |
| December 2025 | 32 | 1,603 | 2.0% |
| January 2026 | 21 | 1,739 | 1.2% |
| February 2026 | 12 | 1,607 | 0.7% |
| March 2026 | 25 | 1,843 | 1.4% |
| April 2026 | 21 | 1,725 | 1.2% |
| May 2026 | 21 | 1,797 | 1.2% |
| June 2026 | 33 | 1,697 | 1.9% |
| July 2026 | 23 | 1,733 | 1.3% |
| August 2026 | 25 | 1,557 | 1.6% |
| September 2026 | 34 | 1,777 | 1.9% |
Seasonal comparisons — matched periods
| Period | Appointments / qualifying | Share | Last year | Change |
|---|---|---|---|---|
| June 2025–August 2025 | 90 / 4,855 | 1.9% | June 2024–August 2024: Unavailable / Unavailable (Unavailable) | — |
| September 2025–November 2025 | 87 / 4,515 | 1.9% | September 2024–November 2024: Unavailable / Unavailable (Unavailable) | — |
| December 2025–February 2026 | 65 / 4,949 | 1.3% | December 2024–February 2025: Unavailable / Unavailable (Unavailable) | — |
| March 2026–May 2026 | 67 / 5,365 | 1.2% | March 2025–May 2025: Unavailable / Unavailable (Unavailable) | — |
| June 2026–August 2026 | 81 / 4,987 | 1.6% | June 2025–August 2025: 90 / 4,855 (1.9%) | -0.2 pp |
| September 2026 | 34 / 1,777 | 1.9% | September 2025: 21 / 1,560 (1.3%) | +0.6 pp |
Testicular & scrotal concernsView figures and history 1.6% 1.5% 1.6%1.9% last year
Testicular & scrotal concerns
Testicular or scrotal symptoms and concerns.
29 of 1,777 qualifying appointments addressed this concern.
Trailing 12 months: 310 appointments (1.5%) of 20,033.
Exact monthly figures — all saved history
| Month | Topic appointments | Qualifying appointments | Share |
|---|---|---|---|
| June 2025 | 18 | 1,787 | 1.0% |
| July 2025 | 25 | 1,617 | 1.5% |
| August 2025 | 27 | 1,451 | 1.9% |
| September 2025 | 29 | 1,560 | 1.9% |
| October 2025 | 27 | 1,450 | 1.9% |
| November 2025 | 27 | 1,505 | 1.8% |
| December 2025 | 28 | 1,603 | 1.7% |
| January 2026 | 17 | 1,739 | 1.0% |
| February 2026 | 21 | 1,607 | 1.3% |
| March 2026 | 30 | 1,843 | 1.6% |
| April 2026 | 21 | 1,725 | 1.2% |
| May 2026 | 19 | 1,797 | 1.1% |
| June 2026 | 28 | 1,697 | 1.6% |
| July 2026 | 36 | 1,733 | 2.1% |
| August 2026 | 27 | 1,557 | 1.7% |
| September 2026 | 29 | 1,777 | 1.6% |
Seasonal comparisons — matched periods
| Period | Appointments / qualifying | Share | Last year | Change |
|---|---|---|---|---|
| June 2025–August 2025 | 70 / 4,855 | 1.4% | June 2024–August 2024: Unavailable / Unavailable (Unavailable) | — |
| September 2025–November 2025 | 83 / 4,515 | 1.8% | September 2024–November 2024: Unavailable / Unavailable (Unavailable) | — |
| December 2025–February 2026 | 66 / 4,949 | 1.3% | December 2024–February 2025: Unavailable / Unavailable (Unavailable) | — |
| March 2026–May 2026 | 70 / 5,365 | 1.3% | March 2025–May 2025: Unavailable / Unavailable (Unavailable) | — |
| June 2026–August 2026 | 91 / 4,987 | 1.8% | June 2025–August 2025: 70 / 4,855 (1.4%) | +0.4 pp |
| September 2026 | 29 / 1,777 | 1.6% | September 2025: 29 / 1,560 (1.9%) | -0.2 pp |
Prostate concernsShow 2 topics Hide topics 0.3% 0.4% 0.3%0.6% last year
ProstatitisView figures and history 0.3% 0.3% 0.3%0.3% last year
Prostatitis
Prostatitis specifically discussed or assessed.
5 of 1,777 qualifying appointments addressed this concern.
Trailing 12 months: 53 appointments (0.3%) of 20,033.
Exact monthly figures — all saved history
| Month | Topic appointments | Qualifying appointments | Share |
|---|---|---|---|
| June 2025 | 5 | 1,787 | 0.3% |
| July 2025 | 3 | 1,617 | 0.2% |
| August 2025 | 4 | 1,451 | 0.3% |
| September 2025 | 4 | 1,560 | 0.3% |
| October 2025 | 6 | 1,450 | 0.4% |
| November 2025 | 10 | 1,505 | 0.7% |
| December 2025 | 3 | 1,603 | 0.2% |
| January 2026 | 4 | 1,739 | 0.2% |
| February 2026 | 4 | 1,607 | 0.2% |
| March 2026 | 3 | 1,843 | 0.2% |
| April 2026 | 3 | 1,725 | 0.2% |
| May 2026 | 2 | 1,797 | 0.1% |
| June 2026 | 3 | 1,697 | 0.2% |
| July 2026 | 2 | 1,733 | 0.1% |
| August 2026 | 8 | 1,557 | 0.5% |
| September 2026 | 5 | 1,777 | 0.3% |
Seasonal comparisons — matched periods
| Period | Appointments / qualifying | Share | Last year | Change |
|---|---|---|---|---|
| June 2025–August 2025 | 12 / 4,855 | 0.2% | June 2024–August 2024: Unavailable / Unavailable (Unavailable) | — |
| September 2025–November 2025 | 20 / 4,515 | 0.4% | September 2024–November 2024: Unavailable / Unavailable (Unavailable) | — |
| December 2025–February 2026 | 11 / 4,949 | 0.2% | December 2024–February 2025: Unavailable / Unavailable (Unavailable) | — |
| March 2026–May 2026 | 8 / 5,365 | 0.1% | March 2025–May 2025: Unavailable / Unavailable (Unavailable) | — |
| June 2026–August 2026 | 13 / 4,987 | 0.3% | June 2025–August 2025: 12 / 4,855 (0.2%) | 0.0 pp |
| September 2026 | 5 / 1,777 | 0.3% | September 2025: 4 / 1,560 (0.3%) | 0.0 pp |
Other prostate concernsView figures and history 0.1% 0.1% 0.1%0.4% last year
Other prostate concerns
Other prostate-related symptoms or concerns.
1 of 1,777 qualifying appointments addressed this concern.
Trailing 12 months: 23 appointments (0.1%) of 20,033.
Exact monthly figures — all saved history
| Month | Topic appointments | Qualifying appointments | Share |
|---|---|---|---|
| June 2025 | 1 | 1,787 | 0.1% |
| July 2025 | 2 | 1,617 | 0.1% |
| August 2025 | 5 | 1,451 | 0.3% |
| September 2025 | 6 | 1,560 | 0.4% |
| October 2025 | 2 | 1,450 | 0.1% |
| November 2025 | 2 | 1,505 | 0.1% |
| December 2025 | 1 | 1,603 | 0.1% |
| January 2026 | 2 | 1,739 | 0.1% |
| February 2026 | 5 | 1,607 | 0.3% |
| March 2026 | 4 | 1,843 | 0.2% |
| April 2026 | 1 | 1,725 | 0.1% |
| May 2026 | 2 | 1,797 | 0.1% |
| June 2026 | 3 | 1,697 | 0.2% |
| July 2026 | 0 | 1,733 | 0.0% |
| August 2026 | 0 | 1,557 | 0.0% |
| September 2026 | 1 | 1,777 | 0.1% |
Seasonal comparisons — matched periods
| Period | Appointments / qualifying | Share | Last year | Change |
|---|---|---|---|---|
| June 2025–August 2025 | 8 / 4,855 | 0.2% | June 2024–August 2024: Unavailable / Unavailable (Unavailable) | — |
| September 2025–November 2025 | 10 / 4,515 | 0.2% | September 2024–November 2024: Unavailable / Unavailable (Unavailable) | — |
| December 2025–February 2026 | 8 / 4,949 | 0.2% | December 2024–February 2025: Unavailable / Unavailable (Unavailable) | — |
| March 2026–May 2026 | 7 / 5,365 | 0.1% | March 2025–May 2025: Unavailable / Unavailable (Unavailable) | — |
| June 2026–August 2026 | 3 / 4,987 | 0.1% | June 2025–August 2025: 8 / 4,855 (0.2%) | -0.1 pp |
| September 2026 | 1 / 1,777 | 0.1% | September 2025: 6 / 1,560 (0.4%) | -0.3 pp |
View trends
Prostate concerns
Prostatitis and other prostate-related symptoms or concerns.
6 of 1,777 qualifying appointments addressed this concern.
Trailing 12 months: 75 appointments (0.4%) of 20,033.
Exact monthly figures — all saved history
| Month | Topic appointments | Qualifying appointments | Share |
|---|---|---|---|
| June 2025 | 6 | 1,787 | 0.3% |
| July 2025 | 5 | 1,617 | 0.3% |
| August 2025 | 9 | 1,451 | 0.6% |
| September 2025 | 10 | 1,560 | 0.6% |
| October 2025 | 8 | 1,450 | 0.6% |
| November 2025 | 11 | 1,505 | 0.7% |
| December 2025 | 4 | 1,603 | 0.2% |
| January 2026 | 6 | 1,739 | 0.3% |
| February 2026 | 9 | 1,607 | 0.6% |
| March 2026 | 7 | 1,843 | 0.4% |
| April 2026 | 4 | 1,725 | 0.2% |
| May 2026 | 4 | 1,797 | 0.2% |
| June 2026 | 6 | 1,697 | 0.4% |
| July 2026 | 2 | 1,733 | 0.1% |
| August 2026 | 8 | 1,557 | 0.5% |
| September 2026 | 6 | 1,777 | 0.3% |
Seasonal comparisons — matched periods
| Period | Appointments / qualifying | Share | Last year | Change |
|---|---|---|---|---|
| June 2025–August 2025 | 20 / 4,855 | 0.4% | June 2024–August 2024: Unavailable / Unavailable (Unavailable) | — |
| September 2025–November 2025 | 29 / 4,515 | 0.6% | September 2024–November 2024: Unavailable / Unavailable (Unavailable) | — |
| December 2025–February 2026 | 19 / 4,949 | 0.4% | December 2024–February 2025: Unavailable / Unavailable (Unavailable) | — |
| March 2026–May 2026 | 15 / 5,365 | 0.3% | March 2025–May 2025: Unavailable / Unavailable (Unavailable) | — |
| June 2026–August 2026 | 16 / 4,987 | 0.3% | June 2025–August 2025: 20 / 4,855 (0.4%) | -0.1 pp |
| September 2026 | 6 / 1,777 | 0.3% | September 2025: 10 / 1,560 (0.6%) | -0.3 pp |
Erectile dysfunctionView figures and history 0.3% 0.3% 0.3%0.1% last year
Erectile dysfunction
Erectile dysfunction specifically discussed or assessed.
6 of 1,777 qualifying appointments addressed this concern.
Trailing 12 months: 63 appointments (0.3%) of 20,033.
Exact monthly figures — all saved history
| Month | Topic appointments | Qualifying appointments | Share |
|---|---|---|---|
| June 2025 | 3 | 1,787 | 0.2% |
| July 2025 | 5 | 1,617 | 0.3% |
| August 2025 | 5 | 1,451 | 0.3% |
| September 2025 | 1 | 1,560 | 0.1% |
| October 2025 | 4 | 1,450 | 0.3% |
| November 2025 | 2 | 1,505 | 0.1% |
| December 2025 | 6 | 1,603 | 0.4% |
| January 2026 | 6 | 1,739 | 0.3% |
| February 2026 | 7 | 1,607 | 0.4% |
| March 2026 | 4 | 1,843 | 0.2% |
| April 2026 | 2 | 1,725 | 0.1% |
| May 2026 | 8 | 1,797 | 0.4% |
| June 2026 | 9 | 1,697 | 0.5% |
| July 2026 | 4 | 1,733 | 0.2% |
| August 2026 | 5 | 1,557 | 0.3% |
| September 2026 | 6 | 1,777 | 0.3% |
Seasonal comparisons — matched periods
| Period | Appointments / qualifying | Share | Last year | Change |
|---|---|---|---|---|
| June 2025–August 2025 | 13 / 4,855 | 0.3% | June 2024–August 2024: Unavailable / Unavailable (Unavailable) | — |
| September 2025–November 2025 | 7 / 4,515 | 0.2% | September 2024–November 2024: Unavailable / Unavailable (Unavailable) | — |
| December 2025–February 2026 | 19 / 4,949 | 0.4% | December 2024–February 2025: Unavailable / Unavailable (Unavailable) | — |
| March 2026–May 2026 | 14 / 5,365 | 0.3% | March 2025–May 2025: Unavailable / Unavailable (Unavailable) | — |
| June 2026–August 2026 | 18 / 4,987 | 0.4% | June 2025–August 2025: 13 / 4,855 (0.3%) | +0.1 pp |
| September 2026 | 6 / 1,777 | 0.3% | September 2025: 1 / 1,560 (0.1%) | +0.3 pp |
Other men's health concernsView figures and history 0.2% 0.2% 0.2%0.3% last year
Other men's health concerns
Other men's health concerns without a more specific recorded category.
4 of 1,777 qualifying appointments addressed this concern.
Trailing 12 months: 45 appointments (0.2%) of 20,033.
Exact monthly figures — all saved history
| Month | Topic appointments | Qualifying appointments | Share |
|---|---|---|---|
| June 2025 | 1 | 1,787 | 0.1% |
| July 2025 | 3 | 1,617 | 0.2% |
| August 2025 | 3 | 1,451 | 0.2% |
| September 2025 | 4 | 1,560 | 0.3% |
| October 2025 | 6 | 1,450 | 0.4% |
| November 2025 | 2 | 1,505 | 0.1% |
| December 2025 | 5 | 1,603 | 0.3% |
| January 2026 | 5 | 1,739 | 0.3% |
| February 2026 | 3 | 1,607 | 0.2% |
| March 2026 | 4 | 1,843 | 0.2% |
| April 2026 | 0 | 1,725 | 0.0% |
| May 2026 | 2 | 1,797 | 0.1% |
| June 2026 | 5 | 1,697 | 0.3% |
| July 2026 | 4 | 1,733 | 0.2% |
| August 2026 | 5 | 1,557 | 0.3% |
| September 2026 | 4 | 1,777 | 0.2% |
Seasonal comparisons — matched periods
| Period | Appointments / qualifying | Share | Last year | Change |
|---|---|---|---|---|
| June 2025–August 2025 | 7 / 4,855 | 0.1% | June 2024–August 2024: Unavailable / Unavailable (Unavailable) | — |
| September 2025–November 2025 | 12 / 4,515 | 0.3% | September 2024–November 2024: Unavailable / Unavailable (Unavailable) | — |
| December 2025–February 2026 | 13 / 4,949 | 0.3% | December 2024–February 2025: Unavailable / Unavailable (Unavailable) | — |
| March 2026–May 2026 | 6 / 5,365 | 0.1% | March 2025–May 2025: Unavailable / Unavailable (Unavailable) | — |
| June 2026–August 2026 | 14 / 4,987 | 0.3% | June 2025–August 2025: 7 / 4,855 (0.1%) | +0.1 pp |
| September 2026 | 4 / 1,777 | 0.2% | September 2025: 4 / 1,560 (0.3%) | 0.0 pp |
View trends
Men's & urogenital health
Erectile, prostate, testicular, scrotal and penile concerns.
74 of 1,777 qualifying appointments addressed this concern.
Trailing 12 months: 765 appointments (3.8%) of 20,033.
Exact monthly figures — all saved history
| Month | Topic appointments | Qualifying appointments | Share |
|---|---|---|---|
| June 2025 | 66 | 1,787 | 3.7% |
| July 2025 | 52 | 1,617 | 3.2% |
| August 2025 | 69 | 1,451 | 4.8% |
| September 2025 | 63 | 1,560 | 4.0% |
| October 2025 | 75 | 1,450 | 5.2% |
| November 2025 | 75 | 1,505 | 5.0% |
| December 2025 | 70 | 1,603 | 4.4% |
| January 2026 | 51 | 1,739 | 2.9% |
| February 2026 | 48 | 1,607 | 3.0% |
| March 2026 | 65 | 1,843 | 3.5% |
| April 2026 | 46 | 1,725 | 2.7% |
| May 2026 | 54 | 1,797 | 3.0% |
| June 2026 | 76 | 1,697 | 4.5% |
| July 2026 | 64 | 1,733 | 3.7% |
| August 2026 | 67 | 1,557 | 4.3% |
| September 2026 | 74 | 1,777 | 4.2% |
Seasonal comparisons — matched periods
| Period | Appointments / qualifying | Share | Last year | Change |
|---|---|---|---|---|
| June 2025–August 2025 | 187 / 4,855 | 3.9% | June 2024–August 2024: Unavailable / Unavailable (Unavailable) | — |
| September 2025–November 2025 | 213 / 4,515 | 4.7% | September 2024–November 2024: Unavailable / Unavailable (Unavailable) | — |
| December 2025–February 2026 | 169 / 4,949 | 3.4% | December 2024–February 2025: Unavailable / Unavailable (Unavailable) | — |
| March 2026–May 2026 | 165 / 5,365 | 3.1% | March 2025–May 2025: Unavailable / Unavailable (Unavailable) | — |
| June 2026–August 2026 | 207 / 4,987 | 4.2% | June 2025–August 2025: 187 / 4,855 (3.9%) | +0.3 pp |
| September 2026 | 74 / 1,777 | 4.2% | September 2025: 63 / 1,560 (4.0%) | +0.1 pp |
Eye & visionShow 3 topics Hide topics 2.6% 2.8% 2.6%2.7% last year
Other eye & vision concernsView figures and history 1.4% 1.2% 1.4%1.0% last year
Other eye & vision concerns
Other eye symptoms, vision changes or eye conditions.
24 of 1,777 qualifying appointments addressed this concern.
Trailing 12 months: 233 appointments (1.2%) of 20,033.
Exact monthly figures — all saved history
| Month | Topic appointments | Qualifying appointments | Share |
|---|---|---|---|
| June 2025 | 17 | 1,787 | 1.0% |
| July 2025 | 16 | 1,617 | 1.0% |
| August 2025 | 16 | 1,451 | 1.1% |
| September 2025 | 16 | 1,560 | 1.0% |
| October 2025 | 13 | 1,450 | 0.9% |
| November 2025 | 15 | 1,505 | 1.0% |
| December 2025 | 15 | 1,603 | 0.9% |
| January 2026 | 20 | 1,739 | 1.2% |
| February 2026 | 28 | 1,607 | 1.7% |
| March 2026 | 25 | 1,843 | 1.4% |
| April 2026 | 18 | 1,725 | 1.0% |
| May 2026 | 21 | 1,797 | 1.2% |
| June 2026 | 15 | 1,697 | 0.9% |
| July 2026 | 19 | 1,733 | 1.1% |
| August 2026 | 20 | 1,557 | 1.3% |
| September 2026 | 24 | 1,777 | 1.4% |
Seasonal comparisons — matched periods
| Period | Appointments / qualifying | Share | Last year | Change |
|---|---|---|---|---|
| June 2025–August 2025 | 49 / 4,855 | 1.0% | June 2024–August 2024: Unavailable / Unavailable (Unavailable) | — |
| September 2025–November 2025 | 44 / 4,515 | 1.0% | September 2024–November 2024: Unavailable / Unavailable (Unavailable) | — |
| December 2025–February 2026 | 63 / 4,949 | 1.3% | December 2024–February 2025: Unavailable / Unavailable (Unavailable) | — |
| March 2026–May 2026 | 64 / 5,365 | 1.2% | March 2025–May 2025: Unavailable / Unavailable (Unavailable) | — |
| June 2026–August 2026 | 54 / 4,987 | 1.1% | June 2025–August 2025: 49 / 4,855 (1.0%) | +0.1 pp |
| September 2026 | 24 / 1,777 | 1.4% | September 2025: 16 / 1,560 (1.0%) | +0.3 pp |
Eyelid concernsShow 3 topics Hide topics 1.1% 1.2% 1.1%1.0% last year
Stye/chalazionView figures and history 0.7% 0.6% 0.7%0.5% last year
Stye/chalazion
A stye or chalazion specifically discussed or assessed.
13 of 1,777 qualifying appointments addressed this concern.
Trailing 12 months: 127 appointments (0.6%) of 20,033.
Exact monthly figures — all saved history
| Month | Topic appointments | Qualifying appointments | Share |
|---|---|---|---|
| June 2025 | 8 | 1,787 | 0.4% |
| July 2025 | 9 | 1,617 | 0.6% |
| August 2025 | 6 | 1,451 | 0.4% |
| September 2025 | 8 | 1,560 | 0.5% |
| October 2025 | 4 | 1,450 | 0.3% |
| November 2025 | 13 | 1,505 | 0.9% |
| December 2025 | 8 | 1,603 | 0.5% |
| January 2026 | 7 | 1,739 | 0.4% |
| February 2026 | 5 | 1,607 | 0.3% |
| March 2026 | 14 | 1,843 | 0.8% |
| April 2026 | 10 | 1,725 | 0.6% |
| May 2026 | 6 | 1,797 | 0.3% |
| June 2026 | 20 | 1,697 | 1.2% |
| July 2026 | 15 | 1,733 | 0.9% |
| August 2026 | 12 | 1,557 | 0.8% |
| September 2026 | 13 | 1,777 | 0.7% |
Seasonal comparisons — matched periods
| Period | Appointments / qualifying | Share | Last year | Change |
|---|---|---|---|---|
| June 2025–August 2025 | 23 / 4,855 | 0.5% | June 2024–August 2024: Unavailable / Unavailable (Unavailable) | — |
| September 2025–November 2025 | 25 / 4,515 | 0.6% | September 2024–November 2024: Unavailable / Unavailable (Unavailable) | — |
| December 2025–February 2026 | 20 / 4,949 | 0.4% | December 2024–February 2025: Unavailable / Unavailable (Unavailable) | — |
| March 2026–May 2026 | 30 / 5,365 | 0.6% | March 2025–May 2025: Unavailable / Unavailable (Unavailable) | — |
| June 2026–August 2026 | 47 / 4,987 | 0.9% | June 2025–August 2025: 23 / 4,855 (0.5%) | +0.5 pp |
| September 2026 | 13 / 1,777 | 0.7% | September 2025: 8 / 1,560 (0.5%) | +0.2 pp |
Other eyelid concernsView figures and history 0.3% 0.4% 0.3%0.4% last year
Other eyelid concerns
Other eyelid symptoms or concerns.
5 of 1,777 qualifying appointments addressed this concern.
Trailing 12 months: 77 appointments (0.4%) of 20,033.
Exact monthly figures — all saved history
| Month | Topic appointments | Qualifying appointments | Share |
|---|---|---|---|
| June 2025 | 4 | 1,787 | 0.2% |
| July 2025 | 4 | 1,617 | 0.2% |
| August 2025 | 5 | 1,451 | 0.3% |
| September 2025 | 6 | 1,560 | 0.4% |
| October 2025 | 1 | 1,450 | 0.1% |
| November 2025 | 10 | 1,505 | 0.7% |
| December 2025 | 5 | 1,603 | 0.3% |
| January 2026 | 5 | 1,739 | 0.3% |
| February 2026 | 9 | 1,607 | 0.6% |
| March 2026 | 5 | 1,843 | 0.3% |
| April 2026 | 9 | 1,725 | 0.5% |
| May 2026 | 10 | 1,797 | 0.6% |
| June 2026 | 6 | 1,697 | 0.4% |
| July 2026 | 9 | 1,733 | 0.5% |
| August 2026 | 3 | 1,557 | 0.2% |
| September 2026 | 5 | 1,777 | 0.3% |
Seasonal comparisons — matched periods
| Period | Appointments / qualifying | Share | Last year | Change |
|---|---|---|---|---|
| June 2025–August 2025 | 13 / 4,855 | 0.3% | June 2024–August 2024: Unavailable / Unavailable (Unavailable) | — |
| September 2025–November 2025 | 17 / 4,515 | 0.4% | September 2024–November 2024: Unavailable / Unavailable (Unavailable) | — |
| December 2025–February 2026 | 19 / 4,949 | 0.4% | December 2024–February 2025: Unavailable / Unavailable (Unavailable) | — |
| March 2026–May 2026 | 24 / 5,365 | 0.4% | March 2025–May 2025: Unavailable / Unavailable (Unavailable) | — |
| June 2026–August 2026 | 18 / 4,987 | 0.4% | June 2025–August 2025: 13 / 4,855 (0.3%) | +0.1 pp |
| September 2026 | 5 / 1,777 | 0.3% | September 2025: 6 / 1,560 (0.4%) | -0.1 pp |
BlepharitisView figures and history 0.1% 0.2% 0.1%0.3% last year
Blepharitis
Blepharitis specifically discussed or assessed.
2 of 1,777 qualifying appointments addressed this concern.
Trailing 12 months: 38 appointments (0.2%) of 20,033.
Exact monthly figures — all saved history
| Month | Topic appointments | Qualifying appointments | Share |
|---|---|---|---|
| June 2025 | 5 | 1,787 | 0.3% |
| July 2025 | 10 | 1,617 | 0.6% |
| August 2025 | 1 | 1,451 | 0.1% |
| September 2025 | 4 | 1,560 | 0.3% |
| October 2025 | 4 | 1,450 | 0.3% |
| November 2025 | 3 | 1,505 | 0.2% |
| December 2025 | 1 | 1,603 | 0.1% |
| January 2026 | 3 | 1,739 | 0.2% |
| February 2026 | 2 | 1,607 | 0.1% |
| March 2026 | 5 | 1,843 | 0.3% |
| April 2026 | 5 | 1,725 | 0.3% |
| May 2026 | 3 | 1,797 | 0.2% |
| June 2026 | 2 | 1,697 | 0.1% |
| July 2026 | 4 | 1,733 | 0.2% |
| August 2026 | 4 | 1,557 | 0.3% |
| September 2026 | 2 | 1,777 | 0.1% |
Seasonal comparisons — matched periods
| Period | Appointments / qualifying | Share | Last year | Change |
|---|---|---|---|---|
| June 2025–August 2025 | 16 / 4,855 | 0.3% | June 2024–August 2024: Unavailable / Unavailable (Unavailable) | — |
| September 2025–November 2025 | 11 / 4,515 | 0.2% | September 2024–November 2024: Unavailable / Unavailable (Unavailable) | — |
| December 2025–February 2026 | 6 / 4,949 | 0.1% | December 2024–February 2025: Unavailable / Unavailable (Unavailable) | — |
| March 2026–May 2026 | 13 / 5,365 | 0.2% | March 2025–May 2025: Unavailable / Unavailable (Unavailable) | — |
| June 2026–August 2026 | 10 / 4,987 | 0.2% | June 2025–August 2025: 16 / 4,855 (0.3%) | -0.1 pp |
| September 2026 | 2 / 1,777 | 0.1% | September 2025: 4 / 1,560 (0.3%) | -0.1 pp |
View trends
Eyelid concerns
Styes, chalazia, blepharitis and other eyelid concerns.
19 of 1,777 qualifying appointments addressed this concern.
Trailing 12 months: 231 appointments (1.2%) of 20,033.
Exact monthly figures — all saved history
| Month | Topic appointments | Qualifying appointments | Share |
|---|---|---|---|
| June 2025 | 16 | 1,787 | 0.9% |
| July 2025 | 20 | 1,617 | 1.2% |
| August 2025 | 12 | 1,451 | 0.8% |
| September 2025 | 15 | 1,560 | 1.0% |
| October 2025 | 9 | 1,450 | 0.6% |
| November 2025 | 24 | 1,505 | 1.6% |
| December 2025 | 14 | 1,603 | 0.9% |
| January 2026 | 15 | 1,739 | 0.9% |
| February 2026 | 16 | 1,607 | 1.0% |
| March 2026 | 22 | 1,843 | 1.2% |
| April 2026 | 22 | 1,725 | 1.3% |
| May 2026 | 18 | 1,797 | 1.0% |
| June 2026 | 27 | 1,697 | 1.6% |
| July 2026 | 27 | 1,733 | 1.6% |
| August 2026 | 18 | 1,557 | 1.2% |
| September 2026 | 19 | 1,777 | 1.1% |
Seasonal comparisons — matched periods
| Period | Appointments / qualifying | Share | Last year | Change |
|---|---|---|---|---|
| June 2025–August 2025 | 48 / 4,855 | 1.0% | June 2024–August 2024: Unavailable / Unavailable (Unavailable) | — |
| September 2025–November 2025 | 48 / 4,515 | 1.1% | September 2024–November 2024: Unavailable / Unavailable (Unavailable) | — |
| December 2025–February 2026 | 45 / 4,949 | 0.9% | December 2024–February 2025: Unavailable / Unavailable (Unavailable) | — |
| March 2026–May 2026 | 62 / 5,365 | 1.2% | March 2025–May 2025: Unavailable / Unavailable (Unavailable) | — |
| June 2026–August 2026 | 72 / 4,987 | 1.4% | June 2025–August 2025: 48 / 4,855 (1.0%) | +0.5 pp |
| September 2026 | 19 / 1,777 | 1.1% | September 2025: 15 / 1,560 (1.0%) | +0.1 pp |
ConjunctivitisView figures and history 0.2% 0.6% 0.2%0.8% last year
Conjunctivitis
Conjunctivitis specifically discussed or assessed.
4 of 1,777 qualifying appointments addressed this concern.
Trailing 12 months: 124 appointments (0.6%) of 20,033.
Exact monthly figures — all saved history
| Month | Topic appointments | Qualifying appointments | Share |
|---|---|---|---|
| June 2025 | 12 | 1,787 | 0.7% |
| July 2025 | 12 | 1,617 | 0.7% |
| August 2025 | 8 | 1,451 | 0.6% |
| September 2025 | 12 | 1,560 | 0.8% |
| October 2025 | 7 | 1,450 | 0.5% |
| November 2025 | 5 | 1,505 | 0.3% |
| December 2025 | 8 | 1,603 | 0.5% |
| January 2026 | 10 | 1,739 | 0.6% |
| February 2026 | 10 | 1,607 | 0.6% |
| March 2026 | 14 | 1,843 | 0.8% |
| April 2026 | 14 | 1,725 | 0.8% |
| May 2026 | 14 | 1,797 | 0.8% |
| June 2026 | 16 | 1,697 | 0.9% |
| July 2026 | 15 | 1,733 | 0.9% |
| August 2026 | 7 | 1,557 | 0.4% |
| September 2026 | 4 | 1,777 | 0.2% |
Seasonal comparisons — matched periods
| Period | Appointments / qualifying | Share | Last year | Change |
|---|---|---|---|---|
| June 2025–August 2025 | 32 / 4,855 | 0.7% | June 2024–August 2024: Unavailable / Unavailable (Unavailable) | — |
| September 2025–November 2025 | 24 / 4,515 | 0.5% | September 2024–November 2024: Unavailable / Unavailable (Unavailable) | — |
| December 2025–February 2026 | 28 / 4,949 | 0.6% | December 2024–February 2025: Unavailable / Unavailable (Unavailable) | — |
| March 2026–May 2026 | 42 / 5,365 | 0.8% | March 2025–May 2025: Unavailable / Unavailable (Unavailable) | — |
| June 2026–August 2026 | 38 / 4,987 | 0.8% | June 2025–August 2025: 32 / 4,855 (0.7%) | +0.1 pp |
| September 2026 | 4 / 1,777 | 0.2% | September 2025: 12 / 1,560 (0.8%) | -0.5 pp |
View trends
Eye & vision
Eye, eyelid and vision concerns.
47 of 1,777 qualifying appointments addressed this concern.
Trailing 12 months: 566 appointments (2.8%) of 20,033.
Exact monthly figures — all saved history
| Month | Topic appointments | Qualifying appointments | Share |
|---|---|---|---|
| June 2025 | 44 | 1,787 | 2.5% |
| July 2025 | 46 | 1,617 | 2.8% |
| August 2025 | 34 | 1,451 | 2.3% |
| September 2025 | 42 | 1,560 | 2.7% |
| October 2025 | 29 | 1,450 | 2.0% |
| November 2025 | 42 | 1,505 | 2.8% |
| December 2025 | 34 | 1,603 | 2.1% |
| January 2026 | 45 | 1,739 | 2.6% |
| February 2026 | 52 | 1,607 | 3.2% |
| March 2026 | 59 | 1,843 | 3.2% |
| April 2026 | 54 | 1,725 | 3.1% |
| May 2026 | 50 | 1,797 | 2.8% |
| June 2026 | 53 | 1,697 | 3.1% |
| July 2026 | 58 | 1,733 | 3.3% |
| August 2026 | 43 | 1,557 | 2.8% |
| September 2026 | 47 | 1,777 | 2.6% |
Seasonal comparisons — matched periods
| Period | Appointments / qualifying | Share | Last year | Change |
|---|---|---|---|---|
| June 2025–August 2025 | 124 / 4,855 | 2.6% | June 2024–August 2024: Unavailable / Unavailable (Unavailable) | — |
| September 2025–November 2025 | 113 / 4,515 | 2.5% | September 2024–November 2024: Unavailable / Unavailable (Unavailable) | — |
| December 2025–February 2026 | 131 / 4,949 | 2.6% | December 2024–February 2025: Unavailable / Unavailable (Unavailable) | — |
| March 2026–May 2026 | 163 / 5,365 | 3.0% | March 2025–May 2025: Unavailable / Unavailable (Unavailable) | — |
| June 2026–August 2026 | 154 / 4,987 | 3.1% | June 2025–August 2025: 124 / 4,855 (2.6%) | +0.5 pp |
| September 2026 | 47 / 1,777 | 2.6% | September 2025: 42 / 1,560 (2.7%) | 0.0 pp |
Hair & nailsShow 4 topics Hide topics 2.4% 1.7% 2.4%1.5% last year
Nail infectionsShow 3 topics Hide topics 1.2% 1.0% 1.2%0.4% last year
Nail-fold infectionView figures and history 0.7% 0.6% 0.7%0.3% last year
Nail-fold infection
Infection around a nail fold specifically discussed or assessed.
12 of 1,777 qualifying appointments addressed this concern.
Trailing 12 months: 116 appointments (0.6%) of 20,033.
Exact monthly figures — all saved history
| Month | Topic appointments | Qualifying appointments | Share |
|---|---|---|---|
| June 2025 | 18 | 1,787 | 1.0% |
| July 2025 | 11 | 1,617 | 0.7% |
| August 2025 | 4 | 1,451 | 0.3% |
| September 2025 | 4 | 1,560 | 0.3% |
| October 2025 | 7 | 1,450 | 0.5% |
| November 2025 | 11 | 1,505 | 0.7% |
| December 2025 | 3 | 1,603 | 0.2% |
| January 2026 | 5 | 1,739 | 0.3% |
| February 2026 | 19 | 1,607 | 1.2% |
| March 2026 | 7 | 1,843 | 0.4% |
| April 2026 | 10 | 1,725 | 0.6% |
| May 2026 | 10 | 1,797 | 0.6% |
| June 2026 | 11 | 1,697 | 0.6% |
| July 2026 | 12 | 1,733 | 0.7% |
| August 2026 | 9 | 1,557 | 0.6% |
| September 2026 | 12 | 1,777 | 0.7% |
Seasonal comparisons — matched periods
| Period | Appointments / qualifying | Share | Last year | Change |
|---|---|---|---|---|
| June 2025–August 2025 | 33 / 4,855 | 0.7% | June 2024–August 2024: Unavailable / Unavailable (Unavailable) | — |
| September 2025–November 2025 | 22 / 4,515 | 0.5% | September 2024–November 2024: Unavailable / Unavailable (Unavailable) | — |
| December 2025–February 2026 | 27 / 4,949 | 0.5% | December 2024–February 2025: Unavailable / Unavailable (Unavailable) | — |
| March 2026–May 2026 | 27 / 5,365 | 0.5% | March 2025–May 2025: Unavailable / Unavailable (Unavailable) | — |
| June 2026–August 2026 | 32 / 4,987 | 0.6% | June 2025–August 2025: 33 / 4,855 (0.7%) | 0.0 pp |
| September 2026 | 12 / 1,777 | 0.7% | September 2025: 4 / 1,560 (0.3%) | +0.4 pp |
Fungal nail infectionView figures and history 0.6% 0.4% 0.6%0.1% last year
Fungal nail infection
Fungal nail infection specifically discussed or assessed.
10 of 1,777 qualifying appointments addressed this concern.
Trailing 12 months: 72 appointments (0.4%) of 20,033.
Exact monthly figures — all saved history
| Month | Topic appointments | Qualifying appointments | Share |
|---|---|---|---|
| June 2025 | 11 | 1,787 | 0.6% |
| July 2025 | 6 | 1,617 | 0.4% |
| August 2025 | 10 | 1,451 | 0.7% |
| September 2025 | 1 | 1,560 | 0.1% |
| October 2025 | 4 | 1,450 | 0.3% |
| November 2025 | 3 | 1,505 | 0.2% |
| December 2025 | 4 | 1,603 | 0.2% |
| January 2026 | 3 | 1,739 | 0.2% |
| February 2026 | 5 | 1,607 | 0.3% |
| March 2026 | 8 | 1,843 | 0.4% |
| April 2026 | 4 | 1,725 | 0.2% |
| May 2026 | 5 | 1,797 | 0.3% |
| June 2026 | 4 | 1,697 | 0.2% |
| July 2026 | 16 | 1,733 | 0.9% |
| August 2026 | 6 | 1,557 | 0.4% |
| September 2026 | 10 | 1,777 | 0.6% |
Seasonal comparisons — matched periods
| Period | Appointments / qualifying | Share | Last year | Change |
|---|---|---|---|---|
| June 2025–August 2025 | 27 / 4,855 | 0.6% | June 2024–August 2024: Unavailable / Unavailable (Unavailable) | — |
| September 2025–November 2025 | 8 / 4,515 | 0.2% | September 2024–November 2024: Unavailable / Unavailable (Unavailable) | — |
| December 2025–February 2026 | 12 / 4,949 | 0.2% | December 2024–February 2025: Unavailable / Unavailable (Unavailable) | — |
| March 2026–May 2026 | 17 / 5,365 | 0.3% | March 2025–May 2025: Unavailable / Unavailable (Unavailable) | — |
| June 2026–August 2026 | 26 / 4,987 | 0.5% | June 2025–August 2025: 27 / 4,855 (0.6%) | 0.0 pp |
| September 2026 | 10 / 1,777 | 0.6% | September 2025: 1 / 1,560 (0.1%) | +0.5 pp |
Other nail infectionView figures and history 0.1% 0.0% 0.1%0.1% last year
Other nail infection
Other nail infection concerns.
1 of 1,777 qualifying appointments addressed this concern.
Trailing 12 months: 9 appointments (0.0%) of 20,033.
Exact monthly figures — all saved history
| Month | Topic appointments | Qualifying appointments | Share |
|---|---|---|---|
| June 2025 | 0 | 1,787 | 0.0% |
| July 2025 | 0 | 1,617 | 0.0% |
| August 2025 | 1 | 1,451 | 0.1% |
| September 2025 | 1 | 1,560 | 0.1% |
| October 2025 | 0 | 1,450 | 0.0% |
| November 2025 | 0 | 1,505 | 0.0% |
| December 2025 | 2 | 1,603 | 0.1% |
| January 2026 | 0 | 1,739 | 0.0% |
| February 2026 | 1 | 1,607 | 0.1% |
| March 2026 | 0 | 1,843 | 0.0% |
| April 2026 | 1 | 1,725 | 0.1% |
| May 2026 | 3 | 1,797 | 0.2% |
| June 2026 | 0 | 1,697 | 0.0% |
| July 2026 | 0 | 1,733 | 0.0% |
| August 2026 | 1 | 1,557 | 0.1% |
| September 2026 | 1 | 1,777 | 0.1% |
Seasonal comparisons — matched periods
| Period | Appointments / qualifying | Share | Last year | Change |
|---|---|---|---|---|
| June 2025–August 2025 | 1 / 4,855 | 0.0% | June 2024–August 2024: Unavailable / Unavailable (Unavailable) | — |
| September 2025–November 2025 | 1 / 4,515 | 0.0% | September 2024–November 2024: Unavailable / Unavailable (Unavailable) | — |
| December 2025–February 2026 | 3 / 4,949 | 0.1% | December 2024–February 2025: Unavailable / Unavailable (Unavailable) | — |
| March 2026–May 2026 | 4 / 5,365 | 0.1% | March 2025–May 2025: Unavailable / Unavailable (Unavailable) | — |
| June 2026–August 2026 | 1 / 4,987 | 0.0% | June 2025–August 2025: 1 / 4,855 (0.0%) | 0.0 pp |
| September 2026 | 1 / 1,777 | 0.1% | September 2025: 1 / 1,560 (0.1%) | 0.0 pp |
View trends
Nail infections
Fungal nail infections, nail-fold infections and other nail infections.
22 of 1,777 qualifying appointments addressed this concern.
Trailing 12 months: 194 appointments (1.0%) of 20,033.
Exact monthly figures — all saved history
| Month | Topic appointments | Qualifying appointments | Share |
|---|---|---|---|
| June 2025 | 28 | 1,787 | 1.6% |
| July 2025 | 17 | 1,617 | 1.1% |
| August 2025 | 15 | 1,451 | 1.0% |
| September 2025 | 6 | 1,560 | 0.4% |
| October 2025 | 11 | 1,450 | 0.8% |
| November 2025 | 14 | 1,505 | 0.9% |
| December 2025 | 9 | 1,603 | 0.6% |
| January 2026 | 8 | 1,739 | 0.5% |
| February 2026 | 24 | 1,607 | 1.5% |
| March 2026 | 15 | 1,843 | 0.8% |
| April 2026 | 15 | 1,725 | 0.9% |
| May 2026 | 17 | 1,797 | 0.9% |
| June 2026 | 15 | 1,697 | 0.9% |
| July 2026 | 28 | 1,733 | 1.6% |
| August 2026 | 16 | 1,557 | 1.0% |
| September 2026 | 22 | 1,777 | 1.2% |
Seasonal comparisons — matched periods
| Period | Appointments / qualifying | Share | Last year | Change |
|---|---|---|---|---|
| June 2025–August 2025 | 60 / 4,855 | 1.2% | June 2024–August 2024: Unavailable / Unavailable (Unavailable) | — |
| September 2025–November 2025 | 31 / 4,515 | 0.7% | September 2024–November 2024: Unavailable / Unavailable (Unavailable) | — |
| December 2025–February 2026 | 41 / 4,949 | 0.8% | December 2024–February 2025: Unavailable / Unavailable (Unavailable) | — |
| March 2026–May 2026 | 47 / 5,365 | 0.9% | March 2025–May 2025: Unavailable / Unavailable (Unavailable) | — |
| June 2026–August 2026 | 59 / 4,987 | 1.2% | June 2025–August 2025: 60 / 4,855 (1.2%) | -0.1 pp |
| September 2026 | 22 / 1,777 | 1.2% | September 2025: 6 / 1,560 (0.4%) | +0.9 pp |
Hair lossView figures and history 0.9% 0.5% 0.9%0.8% last year
Hair loss
Hair loss specifically discussed or assessed.
16 of 1,777 qualifying appointments addressed this concern.
Trailing 12 months: 97 appointments (0.5%) of 20,033.
Exact monthly figures — all saved history
| Month | Topic appointments | Qualifying appointments | Share |
|---|---|---|---|
| June 2025 | 3 | 1,787 | 0.2% |
| July 2025 | 15 | 1,617 | 0.9% |
| August 2025 | 5 | 1,451 | 0.3% |
| September 2025 | 13 | 1,560 | 0.8% |
| October 2025 | 9 | 1,450 | 0.6% |
| November 2025 | 4 | 1,505 | 0.3% |
| December 2025 | 9 | 1,603 | 0.6% |
| January 2026 | 4 | 1,739 | 0.2% |
| February 2026 | 4 | 1,607 | 0.2% |
| March 2026 | 11 | 1,843 | 0.6% |
| April 2026 | 12 | 1,725 | 0.7% |
| May 2026 | 7 | 1,797 | 0.4% |
| June 2026 | 7 | 1,697 | 0.4% |
| July 2026 | 6 | 1,733 | 0.3% |
| August 2026 | 8 | 1,557 | 0.5% |
| September 2026 | 16 | 1,777 | 0.9% |
Seasonal comparisons — matched periods
| Period | Appointments / qualifying | Share | Last year | Change |
|---|---|---|---|---|
| June 2025–August 2025 | 23 / 4,855 | 0.5% | June 2024–August 2024: Unavailable / Unavailable (Unavailable) | — |
| September 2025–November 2025 | 26 / 4,515 | 0.6% | September 2024–November 2024: Unavailable / Unavailable (Unavailable) | — |
| December 2025–February 2026 | 17 / 4,949 | 0.3% | December 2024–February 2025: Unavailable / Unavailable (Unavailable) | — |
| March 2026–May 2026 | 30 / 5,365 | 0.6% | March 2025–May 2025: Unavailable / Unavailable (Unavailable) | — |
| June 2026–August 2026 | 21 / 4,987 | 0.4% | June 2025–August 2025: 23 / 4,855 (0.5%) | -0.1 pp |
| September 2026 | 16 / 1,777 | 0.9% | September 2025: 13 / 1,560 (0.8%) | +0.1 pp |
Other nail concernsView figures and history 0.3% 0.2% 0.3%0.3% last year
Other nail concerns
Other nail symptoms or concerns.
6 of 1,777 qualifying appointments addressed this concern.
Trailing 12 months: 47 appointments (0.2%) of 20,033.
Exact monthly figures — all saved history
| Month | Topic appointments | Qualifying appointments | Share |
|---|---|---|---|
| June 2025 | 3 | 1,787 | 0.2% |
| July 2025 | 4 | 1,617 | 0.2% |
| August 2025 | 4 | 1,451 | 0.3% |
| September 2025 | 5 | 1,560 | 0.3% |
| October 2025 | 0 | 1,450 | 0.0% |
| November 2025 | 1 | 1,505 | 0.1% |
| December 2025 | 3 | 1,603 | 0.2% |
| January 2026 | 3 | 1,739 | 0.2% |
| February 2026 | 2 | 1,607 | 0.1% |
| March 2026 | 3 | 1,843 | 0.2% |
| April 2026 | 7 | 1,725 | 0.4% |
| May 2026 | 4 | 1,797 | 0.2% |
| June 2026 | 6 | 1,697 | 0.4% |
| July 2026 | 8 | 1,733 | 0.5% |
| August 2026 | 4 | 1,557 | 0.3% |
| September 2026 | 6 | 1,777 | 0.3% |
Seasonal comparisons — matched periods
| Period | Appointments / qualifying | Share | Last year | Change |
|---|---|---|---|---|
| June 2025–August 2025 | 11 / 4,855 | 0.2% | June 2024–August 2024: Unavailable / Unavailable (Unavailable) | — |
| September 2025–November 2025 | 6 / 4,515 | 0.1% | September 2024–November 2024: Unavailable / Unavailable (Unavailable) | — |
| December 2025–February 2026 | 8 / 4,949 | 0.2% | December 2024–February 2025: Unavailable / Unavailable (Unavailable) | — |
| March 2026–May 2026 | 14 / 5,365 | 0.3% | March 2025–May 2025: Unavailable / Unavailable (Unavailable) | — |
| June 2026–August 2026 | 18 / 4,987 | 0.4% | June 2025–August 2025: 11 / 4,855 (0.2%) | +0.1 pp |
| September 2026 | 6 / 1,777 | 0.3% | September 2025: 5 / 1,560 (0.3%) | 0.0 pp |
Other hair concernsView figures and history 0.0% 0.0% 0.0%0.0% last year
Other hair concerns
Other hair-related symptoms or concerns.
0 of 1,777 qualifying appointments addressed this concern.
Trailing 12 months: 6 appointments (0.0%) of 20,033.
Exact monthly figures — all saved history
| Month | Topic appointments | Qualifying appointments | Share |
|---|---|---|---|
| June 2025 | 0 | 1,787 | 0.0% |
| July 2025 | 0 | 1,617 | 0.0% |
| August 2025 | 0 | 1,451 | 0.0% |
| September 2025 | 0 | 1,560 | 0.0% |
| October 2025 | 0 | 1,450 | 0.0% |
| November 2025 | 0 | 1,505 | 0.0% |
| December 2025 | 0 | 1,603 | 0.0% |
| January 2026 | 0 | 1,739 | 0.0% |
| February 2026 | 0 | 1,607 | 0.0% |
| March 2026 | 2 | 1,843 | 0.1% |
| April 2026 | 1 | 1,725 | 0.1% |
| May 2026 | 0 | 1,797 | 0.0% |
| June 2026 | 0 | 1,697 | 0.0% |
| July 2026 | 2 | 1,733 | 0.1% |
| August 2026 | 1 | 1,557 | 0.1% |
| September 2026 | 0 | 1,777 | 0.0% |
Seasonal comparisons — matched periods
| Period | Appointments / qualifying | Share | Last year | Change |
|---|---|---|---|---|
| June 2025–August 2025 | 0 / 4,855 | 0.0% | June 2024–August 2024: Unavailable / Unavailable (Unavailable) | — |
| September 2025–November 2025 | 0 / 4,515 | 0.0% | September 2024–November 2024: Unavailable / Unavailable (Unavailable) | — |
| December 2025–February 2026 | 0 / 4,949 | 0.0% | December 2024–February 2025: Unavailable / Unavailable (Unavailable) | — |
| March 2026–May 2026 | 3 / 5,365 | 0.1% | March 2025–May 2025: Unavailable / Unavailable (Unavailable) | — |
| June 2026–August 2026 | 3 / 4,987 | 0.1% | June 2025–August 2025: 0 / 4,855 (0.0%) | +0.1 pp |
| September 2026 | 0 / 1,777 | 0.0% | September 2025: 0 / 1,560 (0.0%) | 0.0 pp |
View trends
Hair & nails
Hair loss, other hair concerns, nail infections and other nail problems.
42 of 1,777 qualifying appointments addressed this concern.
Trailing 12 months: 332 appointments (1.7%) of 20,033.
Exact monthly figures — all saved history
| Month | Topic appointments | Qualifying appointments | Share |
|---|---|---|---|
| June 2025 | 34 | 1,787 | 1.9% |
| July 2025 | 36 | 1,617 | 2.2% |
| August 2025 | 24 | 1,451 | 1.7% |
| September 2025 | 24 | 1,560 | 1.5% |
| October 2025 | 20 | 1,450 | 1.4% |
| November 2025 | 19 | 1,505 | 1.3% |
| December 2025 | 21 | 1,603 | 1.3% |
| January 2026 | 15 | 1,739 | 0.9% |
| February 2026 | 29 | 1,607 | 1.8% |
| March 2026 | 31 | 1,843 | 1.7% |
| April 2026 | 34 | 1,725 | 2.0% |
| May 2026 | 26 | 1,797 | 1.4% |
| June 2026 | 28 | 1,697 | 1.6% |
| July 2026 | 40 | 1,733 | 2.3% |
| August 2026 | 27 | 1,557 | 1.7% |
| September 2026 | 42 | 1,777 | 2.4% |
Seasonal comparisons — matched periods
| Period | Appointments / qualifying | Share | Last year | Change |
|---|---|---|---|---|
| June 2025–August 2025 | 94 / 4,855 | 1.9% | June 2024–August 2024: Unavailable / Unavailable (Unavailable) | — |
| September 2025–November 2025 | 63 / 4,515 | 1.4% | September 2024–November 2024: Unavailable / Unavailable (Unavailable) | — |
| December 2025–February 2026 | 65 / 4,949 | 1.3% | December 2024–February 2025: Unavailable / Unavailable (Unavailable) | — |
| March 2026–May 2026 | 91 / 5,365 | 1.7% | March 2025–May 2025: Unavailable / Unavailable (Unavailable) | — |
| June 2026–August 2026 | 95 / 4,987 | 1.9% | June 2025–August 2025: 94 / 4,855 (1.9%) | 0.0 pp |
| September 2026 | 42 / 1,777 | 2.4% | September 2025: 24 / 1,560 (1.5%) | +0.8 pp |
AllergiesShow 6 topics Hide topics 1.8% 2.1% 1.8%1.9% last year
Hives & allergic reactionsShow 2 topics Hide topics 0.8% 0.6% 0.8%0.4% last year
Hives/urticariaView figures and history 0.6% 0.5% 0.6%0.4% last year
Hives/urticaria
Hives or urticaria discussed or assessed. This category does not establish an allergic cause.
10 of 1,777 qualifying appointments addressed this concern.
Trailing 12 months: 93 appointments (0.5%) of 20,033.
Exact monthly figures — all saved history
| Month | Topic appointments | Qualifying appointments | Share |
|---|---|---|---|
| June 2025 | 5 | 1,787 | 0.3% |
| July 2025 | 6 | 1,617 | 0.4% |
| August 2025 | 7 | 1,451 | 0.5% |
| September 2025 | 6 | 1,560 | 0.4% |
| October 2025 | 2 | 1,450 | 0.1% |
| November 2025 | 14 | 1,505 | 0.9% |
| December 2025 | 8 | 1,603 | 0.5% |
| January 2026 | 6 | 1,739 | 0.3% |
| February 2026 | 7 | 1,607 | 0.4% |
| March 2026 | 8 | 1,843 | 0.4% |
| April 2026 | 7 | 1,725 | 0.4% |
| May 2026 | 12 | 1,797 | 0.7% |
| June 2026 | 5 | 1,697 | 0.3% |
| July 2026 | 7 | 1,733 | 0.4% |
| August 2026 | 7 | 1,557 | 0.4% |
| September 2026 | 10 | 1,777 | 0.6% |
Seasonal comparisons — matched periods
| Period | Appointments / qualifying | Share | Last year | Change |
|---|---|---|---|---|
| June 2025–August 2025 | 18 / 4,855 | 0.4% | June 2024–August 2024: Unavailable / Unavailable (Unavailable) | — |
| September 2025–November 2025 | 22 / 4,515 | 0.5% | September 2024–November 2024: Unavailable / Unavailable (Unavailable) | — |
| December 2025–February 2026 | 21 / 4,949 | 0.4% | December 2024–February 2025: Unavailable / Unavailable (Unavailable) | — |
| March 2026–May 2026 | 27 / 5,365 | 0.5% | March 2025–May 2025: Unavailable / Unavailable (Unavailable) | — |
| June 2026–August 2026 | 19 / 4,987 | 0.4% | June 2025–August 2025: 18 / 4,855 (0.4%) | 0.0 pp |
| September 2026 | 10 / 1,777 | 0.6% | September 2025: 6 / 1,560 (0.4%) | +0.2 pp |
Other allergic reactionsView figures and history 0.2% 0.2% 0.2%0.1% last year
Other allergic reactions
Other allergic reactions discussed or assessed.
4 of 1,777 qualifying appointments addressed this concern.
Trailing 12 months: 37 appointments (0.2%) of 20,033.
Exact monthly figures — all saved history
| Month | Topic appointments | Qualifying appointments | Share |
|---|---|---|---|
| June 2025 | 3 | 1,787 | 0.2% |
| July 2025 | 3 | 1,617 | 0.2% |
| August 2025 | 2 | 1,451 | 0.1% |
| September 2025 | 1 | 1,560 | 0.1% |
| October 2025 | 5 | 1,450 | 0.3% |
| November 2025 | 3 | 1,505 | 0.2% |
| December 2025 | 3 | 1,603 | 0.2% |
| January 2026 | 4 | 1,739 | 0.2% |
| February 2026 | 2 | 1,607 | 0.1% |
| March 2026 | 4 | 1,843 | 0.2% |
| April 2026 | 4 | 1,725 | 0.2% |
| May 2026 | 2 | 1,797 | 0.1% |
| June 2026 | 6 | 1,697 | 0.4% |
| July 2026 | 0 | 1,733 | 0.0% |
| August 2026 | 0 | 1,557 | 0.0% |
| September 2026 | 4 | 1,777 | 0.2% |
Seasonal comparisons — matched periods
| Period | Appointments / qualifying | Share | Last year | Change |
|---|---|---|---|---|
| June 2025–August 2025 | 8 / 4,855 | 0.2% | June 2024–August 2024: Unavailable / Unavailable (Unavailable) | — |
| September 2025–November 2025 | 9 / 4,515 | 0.2% | September 2024–November 2024: Unavailable / Unavailable (Unavailable) | — |
| December 2025–February 2026 | 9 / 4,949 | 0.2% | December 2024–February 2025: Unavailable / Unavailable (Unavailable) | — |
| March 2026–May 2026 | 10 / 5,365 | 0.2% | March 2025–May 2025: Unavailable / Unavailable (Unavailable) | — |
| June 2026–August 2026 | 6 / 4,987 | 0.1% | June 2025–August 2025: 8 / 4,855 (0.2%) | 0.0 pp |
| September 2026 | 4 / 1,777 | 0.2% | September 2025: 1 / 1,560 (0.1%) | +0.2 pp |
View trends
Hives & allergic reactions
Hives, urticaria and other allergic reactions discussed or assessed.
14 of 1,777 qualifying appointments addressed this concern.
Trailing 12 months: 130 appointments (0.6%) of 20,033.
Exact monthly figures — all saved history
| Month | Topic appointments | Qualifying appointments | Share |
|---|---|---|---|
| June 2025 | 8 | 1,787 | 0.4% |
| July 2025 | 9 | 1,617 | 0.6% |
| August 2025 | 9 | 1,451 | 0.6% |
| September 2025 | 7 | 1,560 | 0.4% |
| October 2025 | 7 | 1,450 | 0.5% |
| November 2025 | 17 | 1,505 | 1.1% |
| December 2025 | 11 | 1,603 | 0.7% |
| January 2026 | 10 | 1,739 | 0.6% |
| February 2026 | 9 | 1,607 | 0.6% |
| March 2026 | 12 | 1,843 | 0.7% |
| April 2026 | 11 | 1,725 | 0.6% |
| May 2026 | 14 | 1,797 | 0.8% |
| June 2026 | 11 | 1,697 | 0.6% |
| July 2026 | 7 | 1,733 | 0.4% |
| August 2026 | 7 | 1,557 | 0.4% |
| September 2026 | 14 | 1,777 | 0.8% |
Seasonal comparisons — matched periods
| Period | Appointments / qualifying | Share | Last year | Change |
|---|---|---|---|---|
| June 2025–August 2025 | 26 / 4,855 | 0.5% | June 2024–August 2024: Unavailable / Unavailable (Unavailable) | — |
| September 2025–November 2025 | 31 / 4,515 | 0.7% | September 2024–November 2024: Unavailable / Unavailable (Unavailable) | — |
| December 2025–February 2026 | 30 / 4,949 | 0.6% | December 2024–February 2025: Unavailable / Unavailable (Unavailable) | — |
| March 2026–May 2026 | 37 / 5,365 | 0.7% | March 2025–May 2025: Unavailable / Unavailable (Unavailable) | — |
| June 2026–August 2026 | 25 / 4,987 | 0.5% | June 2025–August 2025: 26 / 4,855 (0.5%) | 0.0 pp |
| September 2026 | 14 / 1,777 | 0.8% | September 2025: 7 / 1,560 (0.4%) | +0.3 pp |
Hay feverView figures and history 0.3% 0.7% 0.3%0.3% last year
Hay fever
Hay fever or pollen-related allergic rhinitis addressed at the appointment.
5 of 1,777 qualifying appointments addressed this concern.
Trailing 12 months: 138 appointments (0.7%) of 20,033.
Exact monthly figures — all saved history
| Month | Topic appointments | Qualifying appointments | Share |
|---|---|---|---|
| June 2025 | 42 | 1,787 | 2.4% |
| July 2025 | 13 | 1,617 | 0.8% |
| August 2025 | 2 | 1,451 | 0.1% |
| September 2025 | 4 | 1,560 | 0.3% |
| October 2025 | 0 | 1,450 | 0.0% |
| November 2025 | 3 | 1,505 | 0.2% |
| December 2025 | 0 | 1,603 | 0.0% |
| January 2026 | 0 | 1,739 | 0.0% |
| February 2026 | 3 | 1,607 | 0.2% |
| March 2026 | 15 | 1,843 | 0.8% |
| April 2026 | 30 | 1,725 | 1.7% |
| May 2026 | 19 | 1,797 | 1.1% |
| June 2026 | 32 | 1,697 | 1.9% |
| July 2026 | 26 | 1,733 | 1.5% |
| August 2026 | 5 | 1,557 | 0.3% |
| September 2026 | 5 | 1,777 | 0.3% |
Seasonal comparisons — matched periods
| Period | Appointments / qualifying | Share | Last year | Change |
|---|---|---|---|---|
| June 2025–August 2025 | 57 / 4,855 | 1.2% | June 2024–August 2024: Unavailable / Unavailable (Unavailable) | — |
| September 2025–November 2025 | 7 / 4,515 | 0.2% | September 2024–November 2024: Unavailable / Unavailable (Unavailable) | — |
| December 2025–February 2026 | 3 / 4,949 | 0.1% | December 2024–February 2025: Unavailable / Unavailable (Unavailable) | — |
| March 2026–May 2026 | 64 / 5,365 | 1.2% | March 2025–May 2025: Unavailable / Unavailable (Unavailable) | — |
| June 2026–August 2026 | 63 / 4,987 | 1.3% | June 2025–August 2025: 57 / 4,855 (1.2%) | +0.1 pp |
| September 2026 | 5 / 1,777 | 0.3% | September 2025: 4 / 1,560 (0.3%) | 0.0 pp |
Drug allergyView figures and history 0.3% 0.3% 0.3%0.6% last year
Drug allergy
Suspected or established allergic reactions to medicines.
5 of 1,777 qualifying appointments addressed this concern.
Trailing 12 months: 55 appointments (0.3%) of 20,033.
Exact monthly figures — all saved history
| Month | Topic appointments | Qualifying appointments | Share |
|---|---|---|---|
| June 2025 | 2 | 1,787 | 0.1% |
| July 2025 | 1 | 1,617 | 0.1% |
| August 2025 | 2 | 1,451 | 0.1% |
| September 2025 | 9 | 1,560 | 0.6% |
| October 2025 | 4 | 1,450 | 0.3% |
| November 2025 | 4 | 1,505 | 0.3% |
| December 2025 | 5 | 1,603 | 0.3% |
| January 2026 | 5 | 1,739 | 0.3% |
| February 2026 | 3 | 1,607 | 0.2% |
| March 2026 | 5 | 1,843 | 0.3% |
| April 2026 | 6 | 1,725 | 0.3% |
| May 2026 | 3 | 1,797 | 0.2% |
| June 2026 | 7 | 1,697 | 0.4% |
| July 2026 | 6 | 1,733 | 0.3% |
| August 2026 | 2 | 1,557 | 0.1% |
| September 2026 | 5 | 1,777 | 0.3% |
Seasonal comparisons — matched periods
| Period | Appointments / qualifying | Share | Last year | Change |
|---|---|---|---|---|
| June 2025–August 2025 | 5 / 4,855 | 0.1% | June 2024–August 2024: Unavailable / Unavailable (Unavailable) | — |
| September 2025–November 2025 | 17 / 4,515 | 0.4% | September 2024–November 2024: Unavailable / Unavailable (Unavailable) | — |
| December 2025–February 2026 | 13 / 4,949 | 0.3% | December 2024–February 2025: Unavailable / Unavailable (Unavailable) | — |
| March 2026–May 2026 | 14 / 5,365 | 0.3% | March 2025–May 2025: Unavailable / Unavailable (Unavailable) | — |
| June 2026–August 2026 | 15 / 4,987 | 0.3% | June 2025–August 2025: 5 / 4,855 (0.1%) | +0.2 pp |
| September 2026 | 5 / 1,777 | 0.3% | September 2025: 9 / 1,560 (0.6%) | -0.3 pp |
Food allergyView figures and history 0.2% 0.2% 0.2%0.1% last year
Food allergy
Food allergy concerns assessed or managed, including suspected allergy.
4 of 1,777 qualifying appointments addressed this concern.
Trailing 12 months: 48 appointments (0.2%) of 20,033.
Exact monthly figures — all saved history
| Month | Topic appointments | Qualifying appointments | Share |
|---|---|---|---|
| June 2025 | 3 | 1,787 | 0.2% |
| July 2025 | 4 | 1,617 | 0.2% |
| August 2025 | 2 | 1,451 | 0.1% |
| September 2025 | 2 | 1,560 | 0.1% |
| October 2025 | 1 | 1,450 | 0.1% |
| November 2025 | 4 | 1,505 | 0.3% |
| December 2025 | 3 | 1,603 | 0.2% |
| January 2026 | 9 | 1,739 | 0.5% |
| February 2026 | 3 | 1,607 | 0.2% |
| March 2026 | 2 | 1,843 | 0.1% |
| April 2026 | 6 | 1,725 | 0.3% |
| May 2026 | 4 | 1,797 | 0.2% |
| June 2026 | 4 | 1,697 | 0.2% |
| July 2026 | 8 | 1,733 | 0.5% |
| August 2026 | 0 | 1,557 | 0.0% |
| September 2026 | 4 | 1,777 | 0.2% |
Seasonal comparisons — matched periods
| Period | Appointments / qualifying | Share | Last year | Change |
|---|---|---|---|---|
| June 2025–August 2025 | 9 / 4,855 | 0.2% | June 2024–August 2024: Unavailable / Unavailable (Unavailable) | — |
| September 2025–November 2025 | 7 / 4,515 | 0.2% | September 2024–November 2024: Unavailable / Unavailable (Unavailable) | — |
| December 2025–February 2026 | 15 / 4,949 | 0.3% | December 2024–February 2025: Unavailable / Unavailable (Unavailable) | — |
| March 2026–May 2026 | 12 / 5,365 | 0.2% | March 2025–May 2025: Unavailable / Unavailable (Unavailable) | — |
| June 2026–August 2026 | 12 / 4,987 | 0.2% | June 2025–August 2025: 9 / 4,855 (0.2%) | +0.1 pp |
| September 2026 | 4 / 1,777 | 0.2% | September 2025: 2 / 1,560 (0.1%) | +0.1 pp |
Other allergy concernsView figures and history 0.2% 0.2% 0.2%0.3% last year
Other allergy concerns
Other allergy concerns and allergy-related questions addressed at the appointment.
3 of 1,777 qualifying appointments addressed this concern.
Trailing 12 months: 31 appointments (0.2%) of 20,033.
Exact monthly figures — all saved history
| Month | Topic appointments | Qualifying appointments | Share |
|---|---|---|---|
| June 2025 | 4 | 1,787 | 0.2% |
| July 2025 | 3 | 1,617 | 0.2% |
| August 2025 | 1 | 1,451 | 0.1% |
| September 2025 | 5 | 1,560 | 0.3% |
| October 2025 | 6 | 1,450 | 0.4% |
| November 2025 | 3 | 1,505 | 0.2% |
| December 2025 | 2 | 1,603 | 0.1% |
| January 2026 | 2 | 1,739 | 0.1% |
| February 2026 | 5 | 1,607 | 0.3% |
| March 2026 | 2 | 1,843 | 0.1% |
| April 2026 | 1 | 1,725 | 0.1% |
| May 2026 | 2 | 1,797 | 0.1% |
| June 2026 | 3 | 1,697 | 0.2% |
| July 2026 | 2 | 1,733 | 0.1% |
| August 2026 | 0 | 1,557 | 0.0% |
| September 2026 | 3 | 1,777 | 0.2% |
Seasonal comparisons — matched periods
| Period | Appointments / qualifying | Share | Last year | Change |
|---|---|---|---|---|
| June 2025–August 2025 | 8 / 4,855 | 0.2% | June 2024–August 2024: Unavailable / Unavailable (Unavailable) | — |
| September 2025–November 2025 | 14 / 4,515 | 0.3% | September 2024–November 2024: Unavailable / Unavailable (Unavailable) | — |
| December 2025–February 2026 | 9 / 4,949 | 0.2% | December 2024–February 2025: Unavailable / Unavailable (Unavailable) | — |
| March 2026–May 2026 | 5 / 5,365 | 0.1% | March 2025–May 2025: Unavailable / Unavailable (Unavailable) | — |
| June 2026–August 2026 | 5 / 4,987 | 0.1% | June 2025–August 2025: 8 / 4,855 (0.2%) | -0.1 pp |
| September 2026 | 3 / 1,777 | 0.2% | September 2025: 5 / 1,560 (0.3%) | -0.2 pp |
Other allergic rhinitisView figures and history 0.1% 0.2% 0.1%0.1% last year
Other allergic rhinitis
Other allergic rhinitis, including year-round or unspecified allergic rhinitis.
2 of 1,777 qualifying appointments addressed this concern.
Trailing 12 months: 37 appointments (0.2%) of 20,033.
Exact monthly figures — all saved history
| Month | Topic appointments | Qualifying appointments | Share |
|---|---|---|---|
| June 2025 | 5 | 1,787 | 0.3% |
| July 2025 | 1 | 1,617 | 0.1% |
| August 2025 | 1 | 1,451 | 0.1% |
| September 2025 | 2 | 1,560 | 0.1% |
| October 2025 | 1 | 1,450 | 0.1% |
| November 2025 | 5 | 1,505 | 0.3% |
| December 2025 | 2 | 1,603 | 0.1% |
| January 2026 | 3 | 1,739 | 0.2% |
| February 2026 | 4 | 1,607 | 0.2% |
| March 2026 | 5 | 1,843 | 0.3% |
| April 2026 | 3 | 1,725 | 0.2% |
| May 2026 | 3 | 1,797 | 0.2% |
| June 2026 | 4 | 1,697 | 0.2% |
| July 2026 | 2 | 1,733 | 0.1% |
| August 2026 | 3 | 1,557 | 0.2% |
| September 2026 | 2 | 1,777 | 0.1% |
Seasonal comparisons — matched periods
| Period | Appointments / qualifying | Share | Last year | Change |
|---|---|---|---|---|
| June 2025–August 2025 | 7 / 4,855 | 0.1% | June 2024–August 2024: Unavailable / Unavailable (Unavailable) | — |
| September 2025–November 2025 | 8 / 4,515 | 0.2% | September 2024–November 2024: Unavailable / Unavailable (Unavailable) | — |
| December 2025–February 2026 | 9 / 4,949 | 0.2% | December 2024–February 2025: Unavailable / Unavailable (Unavailable) | — |
| March 2026–May 2026 | 11 / 5,365 | 0.2% | March 2025–May 2025: Unavailable / Unavailable (Unavailable) | — |
| June 2026–August 2026 | 9 / 4,987 | 0.2% | June 2025–August 2025: 7 / 4,855 (0.1%) | 0.0 pp |
| September 2026 | 2 / 1,777 | 0.1% | September 2025: 2 / 1,560 (0.1%) | 0.0 pp |
View trends
Allergies
Allergy-related concerns, including hay fever, food or medicine allergies and allergic reactions.
32 of 1,777 qualifying appointments addressed this concern.
Trailing 12 months: 420 appointments (2.1%) of 20,033.
Exact monthly figures — all saved history
| Month | Topic appointments | Qualifying appointments | Share |
|---|---|---|---|
| June 2025 | 64 | 1,787 | 3.6% |
| July 2025 | 30 | 1,617 | 1.9% |
| August 2025 | 17 | 1,451 | 1.2% |
| September 2025 | 29 | 1,560 | 1.9% |
| October 2025 | 19 | 1,450 | 1.3% |
| November 2025 | 35 | 1,505 | 2.3% |
| December 2025 | 22 | 1,603 | 1.4% |
| January 2026 | 27 | 1,739 | 1.6% |
| February 2026 | 25 | 1,607 | 1.6% |
| March 2026 | 39 | 1,843 | 2.1% |
| April 2026 | 52 | 1,725 | 3.0% |
| May 2026 | 45 | 1,797 | 2.5% |
| June 2026 | 60 | 1,697 | 3.5% |
| July 2026 | 47 | 1,733 | 2.7% |
| August 2026 | 17 | 1,557 | 1.1% |
| September 2026 | 32 | 1,777 | 1.8% |
Seasonal comparisons — matched periods
| Period | Appointments / qualifying | Share | Last year | Change |
|---|---|---|---|---|
| June 2025–August 2025 | 111 / 4,855 | 2.3% | June 2024–August 2024: Unavailable / Unavailable (Unavailable) | — |
| September 2025–November 2025 | 83 / 4,515 | 1.8% | September 2024–November 2024: Unavailable / Unavailable (Unavailable) | — |
| December 2025–February 2026 | 74 / 4,949 | 1.5% | December 2024–February 2025: Unavailable / Unavailable (Unavailable) | — |
| March 2026–May 2026 | 136 / 5,365 | 2.5% | March 2025–May 2025: Unavailable / Unavailable (Unavailable) | — |
| June 2026–August 2026 | 124 / 4,987 | 2.5% | June 2025–August 2025: 111 / 4,855 (2.3%) | +0.2 pp |
| September 2026 | 32 / 1,777 | 1.8% | September 2025: 29 / 1,560 (1.9%) | -0.1 pp |
Hormones, diabetes & thyroidShow 4 topics Hide topics 1.6% 1.3% 1.6%1.5% last year
DiabetesShow 3 topics Hide topics 0.6% 0.4% 0.6%0.4% last year
Other/unspecified diabetesView figures and history 0.3% 0.2% 0.3%0.2% last year
Other/unspecified diabetes
Other or unspecified diabetes concerns.
6 of 1,777 qualifying appointments addressed this concern.
Trailing 12 months: 31 appointments (0.2%) of 20,033.
Exact monthly figures — all saved history
| Month | Topic appointments | Qualifying appointments | Share |
|---|---|---|---|
| June 2025 | 5 | 1,787 | 0.3% |
| July 2025 | 1 | 1,617 | 0.1% |
| August 2025 | 5 | 1,451 | 0.3% |
| September 2025 | 3 | 1,560 | 0.2% |
| October 2025 | 5 | 1,450 | 0.3% |
| November 2025 | 2 | 1,505 | 0.1% |
| December 2025 | 1 | 1,603 | 0.1% |
| January 2026 | 0 | 1,739 | 0.0% |
| February 2026 | 2 | 1,607 | 0.1% |
| March 2026 | 2 | 1,843 | 0.1% |
| April 2026 | 3 | 1,725 | 0.2% |
| May 2026 | 3 | 1,797 | 0.2% |
| June 2026 | 1 | 1,697 | 0.1% |
| July 2026 | 4 | 1,733 | 0.2% |
| August 2026 | 2 | 1,557 | 0.1% |
| September 2026 | 6 | 1,777 | 0.3% |
Seasonal comparisons — matched periods
| Period | Appointments / qualifying | Share | Last year | Change |
|---|---|---|---|---|
| June 2025–August 2025 | 11 / 4,855 | 0.2% | June 2024–August 2024: Unavailable / Unavailable (Unavailable) | — |
| September 2025–November 2025 | 10 / 4,515 | 0.2% | September 2024–November 2024: Unavailable / Unavailable (Unavailable) | — |
| December 2025–February 2026 | 3 / 4,949 | 0.1% | December 2024–February 2025: Unavailable / Unavailable (Unavailable) | — |
| March 2026–May 2026 | 8 / 5,365 | 0.1% | March 2025–May 2025: Unavailable / Unavailable (Unavailable) | — |
| June 2026–August 2026 | 7 / 4,987 | 0.1% | June 2025–August 2025: 11 / 4,855 (0.2%) | -0.1 pp |
| September 2026 | 6 / 1,777 | 0.3% | September 2025: 3 / 1,560 (0.2%) | +0.1 pp |
Type 2 diabetesView figures and history 0.3% 0.1% 0.3%0.2% last year
Type 2 diabetes
Type 2 diabetes assessment, treatment or review.
5 of 1,777 qualifying appointments addressed this concern.
Trailing 12 months: 29 appointments (0.1%) of 20,033.
Exact monthly figures — all saved history
| Month | Topic appointments | Qualifying appointments | Share |
|---|---|---|---|
| June 2025 | 1 | 1,787 | 0.1% |
| July 2025 | 1 | 1,617 | 0.1% |
| August 2025 | 0 | 1,451 | 0.0% |
| September 2025 | 3 | 1,560 | 0.2% |
| October 2025 | 2 | 1,450 | 0.1% |
| November 2025 | 2 | 1,505 | 0.1% |
| December 2025 | 1 | 1,603 | 0.1% |
| January 2026 | 5 | 1,739 | 0.3% |
| February 2026 | 6 | 1,607 | 0.4% |
| March 2026 | 3 | 1,843 | 0.2% |
| April 2026 | 2 | 1,725 | 0.1% |
| May 2026 | 1 | 1,797 | 0.1% |
| June 2026 | 1 | 1,697 | 0.1% |
| July 2026 | 1 | 1,733 | 0.1% |
| August 2026 | 0 | 1,557 | 0.0% |
| September 2026 | 5 | 1,777 | 0.3% |
Seasonal comparisons — matched periods
| Period | Appointments / qualifying | Share | Last year | Change |
|---|---|---|---|---|
| June 2025–August 2025 | 2 / 4,855 | 0.0% | June 2024–August 2024: Unavailable / Unavailable (Unavailable) | — |
| September 2025–November 2025 | 7 / 4,515 | 0.2% | September 2024–November 2024: Unavailable / Unavailable (Unavailable) | — |
| December 2025–February 2026 | 12 / 4,949 | 0.2% | December 2024–February 2025: Unavailable / Unavailable (Unavailable) | — |
| March 2026–May 2026 | 6 / 5,365 | 0.1% | March 2025–May 2025: Unavailable / Unavailable (Unavailable) | — |
| June 2026–August 2026 | 2 / 4,987 | 0.0% | June 2025–August 2025: 2 / 4,855 (0.0%) | 0.0 pp |
| September 2026 | 5 / 1,777 | 0.3% | September 2025: 3 / 1,560 (0.2%) | +0.1 pp |
Type 1 diabetesView figures and history 0.0% 0.1% 0.0%0.1% last year
Type 1 diabetes
Type 1 diabetes assessment, treatment or review.
0 of 1,777 qualifying appointments addressed this concern.
Trailing 12 months: 19 appointments (0.1%) of 20,033.
Exact monthly figures — all saved history
| Month | Topic appointments | Qualifying appointments | Share |
|---|---|---|---|
| June 2025 | 2 | 1,787 | 0.1% |
| July 2025 | 0 | 1,617 | 0.0% |
| August 2025 | 4 | 1,451 | 0.3% |
| September 2025 | 1 | 1,560 | 0.1% |
| October 2025 | 1 | 1,450 | 0.1% |
| November 2025 | 1 | 1,505 | 0.1% |
| December 2025 | 4 | 1,603 | 0.2% |
| January 2026 | 3 | 1,739 | 0.2% |
| February 2026 | 2 | 1,607 | 0.1% |
| March 2026 | 2 | 1,843 | 0.1% |
| April 2026 | 0 | 1,725 | 0.0% |
| May 2026 | 0 | 1,797 | 0.0% |
| June 2026 | 2 | 1,697 | 0.1% |
| July 2026 | 3 | 1,733 | 0.2% |
| August 2026 | 1 | 1,557 | 0.1% |
| September 2026 | 0 | 1,777 | 0.0% |
Seasonal comparisons — matched periods
| Period | Appointments / qualifying | Share | Last year | Change |
|---|---|---|---|---|
| June 2025–August 2025 | 6 / 4,855 | 0.1% | June 2024–August 2024: Unavailable / Unavailable (Unavailable) | — |
| September 2025–November 2025 | 3 / 4,515 | 0.1% | September 2024–November 2024: Unavailable / Unavailable (Unavailable) | — |
| December 2025–February 2026 | 9 / 4,949 | 0.2% | December 2024–February 2025: Unavailable / Unavailable (Unavailable) | — |
| March 2026–May 2026 | 2 / 5,365 | 0.0% | March 2025–May 2025: Unavailable / Unavailable (Unavailable) | — |
| June 2026–August 2026 | 6 / 4,987 | 0.1% | June 2025–August 2025: 6 / 4,855 (0.1%) | 0.0 pp |
| September 2026 | 0 / 1,777 | 0.0% | September 2025: 1 / 1,560 (0.1%) | -0.1 pp |
View trends
Diabetes
Type 1, type 2 and other diabetes concerns.
11 of 1,777 qualifying appointments addressed this concern.
Trailing 12 months: 79 appointments (0.4%) of 20,033.
Exact monthly figures — all saved history
| Month | Topic appointments | Qualifying appointments | Share |
|---|---|---|---|
| June 2025 | 8 | 1,787 | 0.4% |
| July 2025 | 2 | 1,617 | 0.1% |
| August 2025 | 9 | 1,451 | 0.6% |
| September 2025 | 7 | 1,560 | 0.4% |
| October 2025 | 8 | 1,450 | 0.6% |
| November 2025 | 5 | 1,505 | 0.3% |
| December 2025 | 6 | 1,603 | 0.4% |
| January 2026 | 8 | 1,739 | 0.5% |
| February 2026 | 10 | 1,607 | 0.6% |
| March 2026 | 7 | 1,843 | 0.4% |
| April 2026 | 5 | 1,725 | 0.3% |
| May 2026 | 4 | 1,797 | 0.2% |
| June 2026 | 4 | 1,697 | 0.2% |
| July 2026 | 8 | 1,733 | 0.5% |
| August 2026 | 3 | 1,557 | 0.2% |
| September 2026 | 11 | 1,777 | 0.6% |
Seasonal comparisons — matched periods
| Period | Appointments / qualifying | Share | Last year | Change |
|---|---|---|---|---|
| June 2025–August 2025 | 19 / 4,855 | 0.4% | June 2024–August 2024: Unavailable / Unavailable (Unavailable) | — |
| September 2025–November 2025 | 20 / 4,515 | 0.4% | September 2024–November 2024: Unavailable / Unavailable (Unavailable) | — |
| December 2025–February 2026 | 24 / 4,949 | 0.5% | December 2024–February 2025: Unavailable / Unavailable (Unavailable) | — |
| March 2026–May 2026 | 16 / 5,365 | 0.3% | March 2025–May 2025: Unavailable / Unavailable (Unavailable) | — |
| June 2026–August 2026 | 15 / 4,987 | 0.3% | June 2025–August 2025: 19 / 4,855 (0.4%) | -0.1 pp |
| September 2026 | 11 / 1,777 | 0.6% | September 2025: 7 / 1,560 (0.4%) | +0.2 pp |
Thyroid conditionsShow 3 topics Hide topics 0.5% 0.5% 0.5%0.7% last year
Other thyroid concernsView figures and history 0.3% 0.3% 0.3%0.6% last year
Other thyroid concerns
Other thyroid-related concerns.
6 of 1,777 qualifying appointments addressed this concern.
Trailing 12 months: 67 appointments (0.3%) of 20,033.
Exact monthly figures — all saved history
| Month | Topic appointments | Qualifying appointments | Share |
|---|---|---|---|
| June 2025 | 11 | 1,787 | 0.6% |
| July 2025 | 5 | 1,617 | 0.3% |
| August 2025 | 7 | 1,451 | 0.5% |
| September 2025 | 9 | 1,560 | 0.6% |
| October 2025 | 5 | 1,450 | 0.3% |
| November 2025 | 6 | 1,505 | 0.4% |
| December 2025 | 5 | 1,603 | 0.3% |
| January 2026 | 6 | 1,739 | 0.3% |
| February 2026 | 5 | 1,607 | 0.3% |
| March 2026 | 7 | 1,843 | 0.4% |
| April 2026 | 6 | 1,725 | 0.3% |
| May 2026 | 8 | 1,797 | 0.4% |
| June 2026 | 5 | 1,697 | 0.3% |
| July 2026 | 5 | 1,733 | 0.3% |
| August 2026 | 3 | 1,557 | 0.2% |
| September 2026 | 6 | 1,777 | 0.3% |
Seasonal comparisons — matched periods
| Period | Appointments / qualifying | Share | Last year | Change |
|---|---|---|---|---|
| June 2025–August 2025 | 23 / 4,855 | 0.5% | June 2024–August 2024: Unavailable / Unavailable (Unavailable) | — |
| September 2025–November 2025 | 20 / 4,515 | 0.4% | September 2024–November 2024: Unavailable / Unavailable (Unavailable) | — |
| December 2025–February 2026 | 16 / 4,949 | 0.3% | December 2024–February 2025: Unavailable / Unavailable (Unavailable) | — |
| March 2026–May 2026 | 21 / 5,365 | 0.4% | March 2025–May 2025: Unavailable / Unavailable (Unavailable) | — |
| June 2026–August 2026 | 13 / 4,987 | 0.3% | June 2025–August 2025: 23 / 4,855 (0.5%) | -0.2 pp |
| September 2026 | 6 / 1,777 | 0.3% | September 2025: 9 / 1,560 (0.6%) | -0.2 pp |
Underactive thyroidView figures and history 0.1% 0.2% 0.1%0.1% last year
Underactive thyroid
Underactive thyroid specifically discussed or assessed.
2 of 1,777 qualifying appointments addressed this concern.
Trailing 12 months: 32 appointments (0.2%) of 20,033.
Exact monthly figures — all saved history
| Month | Topic appointments | Qualifying appointments | Share |
|---|---|---|---|
| June 2025 | 3 | 1,787 | 0.2% |
| July 2025 | 3 | 1,617 | 0.2% |
| August 2025 | 3 | 1,451 | 0.2% |
| September 2025 | 1 | 1,560 | 0.1% |
| October 2025 | 2 | 1,450 | 0.1% |
| November 2025 | 3 | 1,505 | 0.2% |
| December 2025 | 1 | 1,603 | 0.1% |
| January 2026 | 0 | 1,739 | 0.0% |
| February 2026 | 3 | 1,607 | 0.2% |
| March 2026 | 5 | 1,843 | 0.3% |
| April 2026 | 4 | 1,725 | 0.2% |
| May 2026 | 3 | 1,797 | 0.2% |
| June 2026 | 3 | 1,697 | 0.2% |
| July 2026 | 2 | 1,733 | 0.1% |
| August 2026 | 4 | 1,557 | 0.3% |
| September 2026 | 2 | 1,777 | 0.1% |
Seasonal comparisons — matched periods
| Period | Appointments / qualifying | Share | Last year | Change |
|---|---|---|---|---|
| June 2025–August 2025 | 9 / 4,855 | 0.2% | June 2024–August 2024: Unavailable / Unavailable (Unavailable) | — |
| September 2025–November 2025 | 6 / 4,515 | 0.1% | September 2024–November 2024: Unavailable / Unavailable (Unavailable) | — |
| December 2025–February 2026 | 4 / 4,949 | 0.1% | December 2024–February 2025: Unavailable / Unavailable (Unavailable) | — |
| March 2026–May 2026 | 12 / 5,365 | 0.2% | March 2025–May 2025: Unavailable / Unavailable (Unavailable) | — |
| June 2026–August 2026 | 9 / 4,987 | 0.2% | June 2025–August 2025: 9 / 4,855 (0.2%) | 0.0 pp |
| September 2026 | 2 / 1,777 | 0.1% | September 2025: 1 / 1,560 (0.1%) | 0.0 pp |
Overactive thyroidView figures and history 0.0% 0.1% 0.0%0.1% last year
Overactive thyroid
Overactive thyroid specifically discussed or assessed.
0 of 1,777 qualifying appointments addressed this concern.
Trailing 12 months: 11 appointments (0.1%) of 20,033.
Exact monthly figures — all saved history
| Month | Topic appointments | Qualifying appointments | Share |
|---|---|---|---|
| June 2025 | 1 | 1,787 | 0.1% |
| July 2025 | 2 | 1,617 | 0.1% |
| August 2025 | 3 | 1,451 | 0.2% |
| September 2025 | 1 | 1,560 | 0.1% |
| October 2025 | 1 | 1,450 | 0.1% |
| November 2025 | 0 | 1,505 | 0.0% |
| December 2025 | 0 | 1,603 | 0.0% |
| January 2026 | 1 | 1,739 | 0.1% |
| February 2026 | 2 | 1,607 | 0.1% |
| March 2026 | 2 | 1,843 | 0.1% |
| April 2026 | 1 | 1,725 | 0.1% |
| May 2026 | 1 | 1,797 | 0.1% |
| June 2026 | 0 | 1,697 | 0.0% |
| July 2026 | 2 | 1,733 | 0.1% |
| August 2026 | 1 | 1,557 | 0.1% |
| September 2026 | 0 | 1,777 | 0.0% |
Seasonal comparisons — matched periods
| Period | Appointments / qualifying | Share | Last year | Change |
|---|---|---|---|---|
| June 2025–August 2025 | 6 / 4,855 | 0.1% | June 2024–August 2024: Unavailable / Unavailable (Unavailable) | — |
| September 2025–November 2025 | 2 / 4,515 | 0.0% | September 2024–November 2024: Unavailable / Unavailable (Unavailable) | — |
| December 2025–February 2026 | 3 / 4,949 | 0.1% | December 2024–February 2025: Unavailable / Unavailable (Unavailable) | — |
| March 2026–May 2026 | 4 / 5,365 | 0.1% | March 2025–May 2025: Unavailable / Unavailable (Unavailable) | — |
| June 2026–August 2026 | 3 / 4,987 | 0.1% | June 2025–August 2025: 6 / 4,855 (0.1%) | -0.1 pp |
| September 2026 | 0 / 1,777 | 0.0% | September 2025: 1 / 1,560 (0.1%) | -0.1 pp |
View trends
Thyroid conditions
Underactive thyroid, overactive thyroid and other thyroid concerns.
8 of 1,777 qualifying appointments addressed this concern.
Trailing 12 months: 110 appointments (0.5%) of 20,033.
Exact monthly figures — all saved history
| Month | Topic appointments | Qualifying appointments | Share |
|---|---|---|---|
| June 2025 | 15 | 1,787 | 0.8% |
| July 2025 | 10 | 1,617 | 0.6% |
| August 2025 | 13 | 1,451 | 0.9% |
| September 2025 | 11 | 1,560 | 0.7% |
| October 2025 | 8 | 1,450 | 0.6% |
| November 2025 | 9 | 1,505 | 0.6% |
| December 2025 | 6 | 1,603 | 0.4% |
| January 2026 | 7 | 1,739 | 0.4% |
| February 2026 | 10 | 1,607 | 0.6% |
| March 2026 | 14 | 1,843 | 0.8% |
| April 2026 | 11 | 1,725 | 0.6% |
| May 2026 | 12 | 1,797 | 0.7% |
| June 2026 | 8 | 1,697 | 0.5% |
| July 2026 | 9 | 1,733 | 0.5% |
| August 2026 | 8 | 1,557 | 0.5% |
| September 2026 | 8 | 1,777 | 0.5% |
Seasonal comparisons — matched periods
| Period | Appointments / qualifying | Share | Last year | Change |
|---|---|---|---|---|
| June 2025–August 2025 | 38 / 4,855 | 0.8% | June 2024–August 2024: Unavailable / Unavailable (Unavailable) | — |
| September 2025–November 2025 | 28 / 4,515 | 0.6% | September 2024–November 2024: Unavailable / Unavailable (Unavailable) | — |
| December 2025–February 2026 | 23 / 4,949 | 0.5% | December 2024–February 2025: Unavailable / Unavailable (Unavailable) | — |
| March 2026–May 2026 | 37 / 5,365 | 0.7% | March 2025–May 2025: Unavailable / Unavailable (Unavailable) | — |
| June 2026–August 2026 | 25 / 4,987 | 0.5% | June 2025–August 2025: 38 / 4,855 (0.8%) | -0.3 pp |
| September 2026 | 8 / 1,777 | 0.5% | September 2025: 11 / 1,560 (0.7%) | -0.3 pp |
Other hormonal concernsView figures and history 0.5% 0.3% 0.5%0.3% last year
Other hormonal concerns
Other hormonal concerns discussed or assessed.
8 of 1,777 qualifying appointments addressed this concern.
Trailing 12 months: 57 appointments (0.3%) of 20,033.
Exact monthly figures — all saved history
| Month | Topic appointments | Qualifying appointments | Share |
|---|---|---|---|
| June 2025 | 5 | 1,787 | 0.3% |
| July 2025 | 5 | 1,617 | 0.3% |
| August 2025 | 5 | 1,451 | 0.3% |
| September 2025 | 5 | 1,560 | 0.3% |
| October 2025 | 3 | 1,450 | 0.2% |
| November 2025 | 4 | 1,505 | 0.3% |
| December 2025 | 5 | 1,603 | 0.3% |
| January 2026 | 4 | 1,739 | 0.2% |
| February 2026 | 3 | 1,607 | 0.2% |
| March 2026 | 3 | 1,843 | 0.2% |
| April 2026 | 5 | 1,725 | 0.3% |
| May 2026 | 3 | 1,797 | 0.2% |
| June 2026 | 9 | 1,697 | 0.5% |
| July 2026 | 4 | 1,733 | 0.2% |
| August 2026 | 6 | 1,557 | 0.4% |
| September 2026 | 8 | 1,777 | 0.5% |
Seasonal comparisons — matched periods
| Period | Appointments / qualifying | Share | Last year | Change |
|---|---|---|---|---|
| June 2025–August 2025 | 15 / 4,855 | 0.3% | June 2024–August 2024: Unavailable / Unavailable (Unavailable) | — |
| September 2025–November 2025 | 12 / 4,515 | 0.3% | September 2024–November 2024: Unavailable / Unavailable (Unavailable) | — |
| December 2025–February 2026 | 12 / 4,949 | 0.2% | December 2024–February 2025: Unavailable / Unavailable (Unavailable) | — |
| March 2026–May 2026 | 11 / 5,365 | 0.2% | March 2025–May 2025: Unavailable / Unavailable (Unavailable) | — |
| June 2026–August 2026 | 19 / 4,987 | 0.4% | June 2025–August 2025: 15 / 4,855 (0.3%) | +0.1 pp |
| September 2026 | 8 / 1,777 | 0.5% | September 2025: 5 / 1,560 (0.3%) | +0.1 pp |
PrediabetesView figures and history 0.1% 0.1% 0.1%0.1% last year
Prediabetes
Prediabetes specifically discussed or assessed.
2 of 1,777 qualifying appointments addressed this concern.
Trailing 12 months: 20 appointments (0.1%) of 20,033.
Exact monthly figures — all saved history
| Month | Topic appointments | Qualifying appointments | Share |
|---|---|---|---|
| June 2025 | 2 | 1,787 | 0.1% |
| July 2025 | 3 | 1,617 | 0.2% |
| August 2025 | 1 | 1,451 | 0.1% |
| September 2025 | 1 | 1,560 | 0.1% |
| October 2025 | 2 | 1,450 | 0.1% |
| November 2025 | 2 | 1,505 | 0.1% |
| December 2025 | 1 | 1,603 | 0.1% |
| January 2026 | 3 | 1,739 | 0.2% |
| February 2026 | 2 | 1,607 | 0.1% |
| March 2026 | 1 | 1,843 | 0.1% |
| April 2026 | 0 | 1,725 | 0.0% |
| May 2026 | 1 | 1,797 | 0.1% |
| June 2026 | 3 | 1,697 | 0.2% |
| July 2026 | 2 | 1,733 | 0.1% |
| August 2026 | 1 | 1,557 | 0.1% |
| September 2026 | 2 | 1,777 | 0.1% |
Seasonal comparisons — matched periods
| Period | Appointments / qualifying | Share | Last year | Change |
|---|---|---|---|---|
| June 2025–August 2025 | 6 / 4,855 | 0.1% | June 2024–August 2024: Unavailable / Unavailable (Unavailable) | — |
| September 2025–November 2025 | 5 / 4,515 | 0.1% | September 2024–November 2024: Unavailable / Unavailable (Unavailable) | — |
| December 2025–February 2026 | 6 / 4,949 | 0.1% | December 2024–February 2025: Unavailable / Unavailable (Unavailable) | — |
| March 2026–May 2026 | 2 / 5,365 | 0.0% | March 2025–May 2025: Unavailable / Unavailable (Unavailable) | — |
| June 2026–August 2026 | 6 / 4,987 | 0.1% | June 2025–August 2025: 6 / 4,855 (0.1%) | 0.0 pp |
| September 2026 | 2 / 1,777 | 0.1% | September 2025: 1 / 1,560 (0.1%) | 0.0 pp |
View trends
Hormones, diabetes & thyroid
Diabetes, prediabetes, thyroid and other hormonal concerns.
29 of 1,777 qualifying appointments addressed this concern.
Trailing 12 months: 260 appointments (1.3%) of 20,033.
Exact monthly figures — all saved history
| Month | Topic appointments | Qualifying appointments | Share |
|---|---|---|---|
| June 2025 | 30 | 1,787 | 1.7% |
| July 2025 | 20 | 1,617 | 1.2% |
| August 2025 | 27 | 1,451 | 1.9% |
| September 2025 | 24 | 1,560 | 1.5% |
| October 2025 | 20 | 1,450 | 1.4% |
| November 2025 | 19 | 1,505 | 1.3% |
| December 2025 | 17 | 1,603 | 1.1% |
| January 2026 | 22 | 1,739 | 1.3% |
| February 2026 | 22 | 1,607 | 1.4% |
| March 2026 | 25 | 1,843 | 1.4% |
| April 2026 | 21 | 1,725 | 1.2% |
| May 2026 | 20 | 1,797 | 1.1% |
| June 2026 | 24 | 1,697 | 1.4% |
| July 2026 | 23 | 1,733 | 1.3% |
| August 2026 | 18 | 1,557 | 1.2% |
| September 2026 | 29 | 1,777 | 1.6% |
Seasonal comparisons — matched periods
| Period | Appointments / qualifying | Share | Last year | Change |
|---|---|---|---|---|
| June 2025–August 2025 | 77 / 4,855 | 1.6% | June 2024–August 2024: Unavailable / Unavailable (Unavailable) | — |
| September 2025–November 2025 | 63 / 4,515 | 1.4% | September 2024–November 2024: Unavailable / Unavailable (Unavailable) | — |
| December 2025–February 2026 | 61 / 4,949 | 1.2% | December 2024–February 2025: Unavailable / Unavailable (Unavailable) | — |
| March 2026–May 2026 | 66 / 5,365 | 1.2% | March 2025–May 2025: Unavailable / Unavailable (Unavailable) | — |
| June 2026–August 2026 | 65 / 4,987 | 1.3% | June 2025–August 2025: 77 / 4,855 (1.6%) | -0.3 pp |
| September 2026 | 29 / 1,777 | 1.6% | September 2025: 24 / 1,560 (1.5%) | +0.1 pp |
Mouth & dentalShow 2 topics Hide topics 1.5% 1.6% 1.5%1.5% last year
Other mouth concernsShow 3 topics Hide topics 1.1% 1.3% 1.1%1.0% last year
Oral thrushView figures and history 0.5% 0.3% 0.5%0.3% last year
Oral thrush
Oral thrush specifically discussed or assessed.
9 of 1,777 qualifying appointments addressed this concern.
Trailing 12 months: 68 appointments (0.3%) of 20,033.
Exact monthly figures — all saved history
| Month | Topic appointments | Qualifying appointments | Share |
|---|---|---|---|
| June 2025 | 8 | 1,787 | 0.4% |
| July 2025 | 6 | 1,617 | 0.4% |
| August 2025 | 9 | 1,451 | 0.6% |
| September 2025 | 5 | 1,560 | 0.3% |
| October 2025 | 7 | 1,450 | 0.5% |
| November 2025 | 11 | 1,505 | 0.7% |
| December 2025 | 3 | 1,603 | 0.2% |
| January 2026 | 6 | 1,739 | 0.3% |
| February 2026 | 1 | 1,607 | 0.1% |
| March 2026 | 5 | 1,843 | 0.3% |
| April 2026 | 4 | 1,725 | 0.2% |
| May 2026 | 4 | 1,797 | 0.2% |
| June 2026 | 6 | 1,697 | 0.4% |
| July 2026 | 7 | 1,733 | 0.4% |
| August 2026 | 5 | 1,557 | 0.3% |
| September 2026 | 9 | 1,777 | 0.5% |
Seasonal comparisons — matched periods
| Period | Appointments / qualifying | Share | Last year | Change |
|---|---|---|---|---|
| June 2025–August 2025 | 23 / 4,855 | 0.5% | June 2024–August 2024: Unavailable / Unavailable (Unavailable) | — |
| September 2025–November 2025 | 23 / 4,515 | 0.5% | September 2024–November 2024: Unavailable / Unavailable (Unavailable) | — |
| December 2025–February 2026 | 10 / 4,949 | 0.2% | December 2024–February 2025: Unavailable / Unavailable (Unavailable) | — |
| March 2026–May 2026 | 13 / 5,365 | 0.2% | March 2025–May 2025: Unavailable / Unavailable (Unavailable) | — |
| June 2026–August 2026 | 18 / 4,987 | 0.4% | June 2025–August 2025: 23 / 4,855 (0.5%) | -0.1 pp |
| September 2026 | 9 / 1,777 | 0.5% | September 2025: 5 / 1,560 (0.3%) | +0.2 pp |
Other mouth concernsView figures and history 0.3% 0.6% 0.3%0.4% last year
Other mouth concerns
Other mouth symptoms or concerns.
6 of 1,777 qualifying appointments addressed this concern.
Trailing 12 months: 127 appointments (0.6%) of 20,033.
Exact monthly figures — all saved history
| Month | Topic appointments | Qualifying appointments | Share |
|---|---|---|---|
| June 2025 | 7 | 1,787 | 0.4% |
| July 2025 | 7 | 1,617 | 0.4% |
| August 2025 | 5 | 1,451 | 0.3% |
| September 2025 | 7 | 1,560 | 0.4% |
| October 2025 | 6 | 1,450 | 0.4% |
| November 2025 | 7 | 1,505 | 0.5% |
| December 2025 | 9 | 1,603 | 0.6% |
| January 2026 | 16 | 1,739 | 0.9% |
| February 2026 | 15 | 1,607 | 0.9% |
| March 2026 | 13 | 1,843 | 0.7% |
| April 2026 | 11 | 1,725 | 0.6% |
| May 2026 | 11 | 1,797 | 0.6% |
| June 2026 | 17 | 1,697 | 1.0% |
| July 2026 | 10 | 1,733 | 0.6% |
| August 2026 | 6 | 1,557 | 0.4% |
| September 2026 | 6 | 1,777 | 0.3% |
Seasonal comparisons — matched periods
| Period | Appointments / qualifying | Share | Last year | Change |
|---|---|---|---|---|
| June 2025–August 2025 | 19 / 4,855 | 0.4% | June 2024–August 2024: Unavailable / Unavailable (Unavailable) | — |
| September 2025–November 2025 | 20 / 4,515 | 0.4% | September 2024–November 2024: Unavailable / Unavailable (Unavailable) | — |
| December 2025–February 2026 | 40 / 4,949 | 0.8% | December 2024–February 2025: Unavailable / Unavailable (Unavailable) | — |
| March 2026–May 2026 | 35 / 5,365 | 0.7% | March 2025–May 2025: Unavailable / Unavailable (Unavailable) | — |
| June 2026–August 2026 | 33 / 4,987 | 0.7% | June 2025–August 2025: 19 / 4,855 (0.4%) | +0.3 pp |
| September 2026 | 6 / 1,777 | 0.3% | September 2025: 7 / 1,560 (0.4%) | -0.1 pp |
Mouth ulcersView figures and history 0.3% 0.3% 0.3%0.3% last year
Mouth ulcers
Mouth ulcers specifically discussed or assessed.
5 of 1,777 qualifying appointments addressed this concern.
Trailing 12 months: 70 appointments (0.3%) of 20,033.
Exact monthly figures — all saved history
| Month | Topic appointments | Qualifying appointments | Share |
|---|---|---|---|
| June 2025 | 5 | 1,787 | 0.3% |
| July 2025 | 10 | 1,617 | 0.6% |
| August 2025 | 7 | 1,451 | 0.5% |
| September 2025 | 4 | 1,560 | 0.3% |
| October 2025 | 7 | 1,450 | 0.5% |
| November 2025 | 9 | 1,505 | 0.6% |
| December 2025 | 7 | 1,603 | 0.4% |
| January 2026 | 9 | 1,739 | 0.5% |
| February 2026 | 7 | 1,607 | 0.4% |
| March 2026 | 2 | 1,843 | 0.1% |
| April 2026 | 3 | 1,725 | 0.2% |
| May 2026 | 4 | 1,797 | 0.2% |
| June 2026 | 6 | 1,697 | 0.4% |
| July 2026 | 6 | 1,733 | 0.3% |
| August 2026 | 5 | 1,557 | 0.3% |
| September 2026 | 5 | 1,777 | 0.3% |
Seasonal comparisons — matched periods
| Period | Appointments / qualifying | Share | Last year | Change |
|---|---|---|---|---|
| June 2025–August 2025 | 22 / 4,855 | 0.5% | June 2024–August 2024: Unavailable / Unavailable (Unavailable) | — |
| September 2025–November 2025 | 20 / 4,515 | 0.4% | September 2024–November 2024: Unavailable / Unavailable (Unavailable) | — |
| December 2025–February 2026 | 23 / 4,949 | 0.5% | December 2024–February 2025: Unavailable / Unavailable (Unavailable) | — |
| March 2026–May 2026 | 9 / 5,365 | 0.2% | March 2025–May 2025: Unavailable / Unavailable (Unavailable) | — |
| June 2026–August 2026 | 17 / 4,987 | 0.3% | June 2025–August 2025: 22 / 4,855 (0.5%) | -0.1 pp |
| September 2026 | 5 / 1,777 | 0.3% | September 2025: 4 / 1,560 (0.3%) | 0.0 pp |
View trends
Other mouth concerns
Oral thrush, mouth ulcers and other mouth concerns.
19 of 1,777 qualifying appointments addressed this concern.
Trailing 12 months: 253 appointments (1.3%) of 20,033.
Exact monthly figures — all saved history
| Month | Topic appointments | Qualifying appointments | Share |
|---|---|---|---|
| June 2025 | 20 | 1,787 | 1.1% |
| July 2025 | 23 | 1,617 | 1.4% |
| August 2025 | 19 | 1,451 | 1.3% |
| September 2025 | 16 | 1,560 | 1.0% |
| October 2025 | 17 | 1,450 | 1.2% |
| November 2025 | 24 | 1,505 | 1.6% |
| December 2025 | 16 | 1,603 | 1.0% |
| January 2026 | 30 | 1,739 | 1.7% |
| February 2026 | 23 | 1,607 | 1.4% |
| March 2026 | 20 | 1,843 | 1.1% |
| April 2026 | 18 | 1,725 | 1.0% |
| May 2026 | 19 | 1,797 | 1.1% |
| June 2026 | 29 | 1,697 | 1.7% |
| July 2026 | 22 | 1,733 | 1.3% |
| August 2026 | 16 | 1,557 | 1.0% |
| September 2026 | 19 | 1,777 | 1.1% |
Seasonal comparisons — matched periods
| Period | Appointments / qualifying | Share | Last year | Change |
|---|---|---|---|---|
| June 2025–August 2025 | 62 / 4,855 | 1.3% | June 2024–August 2024: Unavailable / Unavailable (Unavailable) | — |
| September 2025–November 2025 | 57 / 4,515 | 1.3% | September 2024–November 2024: Unavailable / Unavailable (Unavailable) | — |
| December 2025–February 2026 | 69 / 4,949 | 1.4% | December 2024–February 2025: Unavailable / Unavailable (Unavailable) | — |
| March 2026–May 2026 | 57 / 5,365 | 1.1% | March 2025–May 2025: Unavailable / Unavailable (Unavailable) | — |
| June 2026–August 2026 | 67 / 4,987 | 1.3% | June 2025–August 2025: 62 / 4,855 (1.3%) | +0.1 pp |
| September 2026 | 19 / 1,777 | 1.1% | September 2025: 16 / 1,560 (1.0%) | 0.0 pp |
Dental concernsView figures and history 0.4% 0.3% 0.4%0.5% last year
Dental concerns
Tooth or gum concerns, including pain or dental infection.
7 of 1,777 qualifying appointments addressed this concern.
Trailing 12 months: 66 appointments (0.3%) of 20,033.
Exact monthly figures — all saved history
| Month | Topic appointments | Qualifying appointments | Share |
|---|---|---|---|
| June 2025 | 8 | 1,787 | 0.4% |
| July 2025 | 3 | 1,617 | 0.2% |
| August 2025 | 8 | 1,451 | 0.6% |
| September 2025 | 8 | 1,560 | 0.5% |
| October 2025 | 3 | 1,450 | 0.2% |
| November 2025 | 4 | 1,505 | 0.3% |
| December 2025 | 4 | 1,603 | 0.2% |
| January 2026 | 8 | 1,739 | 0.5% |
| February 2026 | 3 | 1,607 | 0.2% |
| March 2026 | 6 | 1,843 | 0.3% |
| April 2026 | 5 | 1,725 | 0.3% |
| May 2026 | 11 | 1,797 | 0.6% |
| June 2026 | 4 | 1,697 | 0.2% |
| July 2026 | 6 | 1,733 | 0.3% |
| August 2026 | 5 | 1,557 | 0.3% |
| September 2026 | 7 | 1,777 | 0.4% |
Seasonal comparisons — matched periods
| Period | Appointments / qualifying | Share | Last year | Change |
|---|---|---|---|---|
| June 2025–August 2025 | 19 / 4,855 | 0.4% | June 2024–August 2024: Unavailable / Unavailable (Unavailable) | — |
| September 2025–November 2025 | 15 / 4,515 | 0.3% | September 2024–November 2024: Unavailable / Unavailable (Unavailable) | — |
| December 2025–February 2026 | 15 / 4,949 | 0.3% | December 2024–February 2025: Unavailable / Unavailable (Unavailable) | — |
| March 2026–May 2026 | 22 / 5,365 | 0.4% | March 2025–May 2025: Unavailable / Unavailable (Unavailable) | — |
| June 2026–August 2026 | 15 / 4,987 | 0.3% | June 2025–August 2025: 19 / 4,855 (0.4%) | -0.1 pp |
| September 2026 | 7 / 1,777 | 0.4% | September 2025: 8 / 1,560 (0.5%) | -0.1 pp |
View trends
Mouth & dental
Tooth, gum and other mouth concerns.
26 of 1,777 qualifying appointments addressed this concern.
Trailing 12 months: 312 appointments (1.6%) of 20,033.
Exact monthly figures — all saved history
| Month | Topic appointments | Qualifying appointments | Share |
|---|---|---|---|
| June 2025 | 27 | 1,787 | 1.5% |
| July 2025 | 26 | 1,617 | 1.6% |
| August 2025 | 26 | 1,451 | 1.8% |
| September 2025 | 24 | 1,560 | 1.5% |
| October 2025 | 20 | 1,450 | 1.4% |
| November 2025 | 26 | 1,505 | 1.7% |
| December 2025 | 20 | 1,603 | 1.2% |
| January 2026 | 37 | 1,739 | 2.1% |
| February 2026 | 26 | 1,607 | 1.6% |
| March 2026 | 25 | 1,843 | 1.4% |
| April 2026 | 22 | 1,725 | 1.3% |
| May 2026 | 30 | 1,797 | 1.7% |
| June 2026 | 33 | 1,697 | 1.9% |
| July 2026 | 27 | 1,733 | 1.6% |
| August 2026 | 20 | 1,557 | 1.3% |
| September 2026 | 26 | 1,777 | 1.5% |
Seasonal comparisons — matched periods
| Period | Appointments / qualifying | Share | Last year | Change |
|---|---|---|---|---|
| June 2025–August 2025 | 79 / 4,855 | 1.6% | June 2024–August 2024: Unavailable / Unavailable (Unavailable) | — |
| September 2025–November 2025 | 70 / 4,515 | 1.6% | September 2024–November 2024: Unavailable / Unavailable (Unavailable) | — |
| December 2025–February 2026 | 83 / 4,949 | 1.7% | December 2024–February 2025: Unavailable / Unavailable (Unavailable) | — |
| March 2026–May 2026 | 77 / 5,365 | 1.4% | March 2025–May 2025: Unavailable / Unavailable (Unavailable) | — |
| June 2026–August 2026 | 80 / 4,987 | 1.6% | June 2025–August 2025: 79 / 4,855 (1.6%) | 0.0 pp |
| September 2026 | 26 / 1,777 | 1.5% | September 2025: 24 / 1,560 (1.5%) | -0.1 pp |
OtherShow 1 topic Hide topics 1.5% 1.2% 1.5%1.2% last year
Other specified concernsView figures and history 1.5% 1.2% 1.5%1.2% last year
Other specified concerns
Other specifically assessed clinical concerns outside the defined topics.
26 of 1,777 qualifying appointments addressed this concern.
Trailing 12 months: 239 appointments (1.2%) of 20,033.
Exact monthly figures — all saved history
| Month | Topic appointments | Qualifying appointments | Share |
|---|---|---|---|
| June 2025 | 19 | 1,787 | 1.1% |
| July 2025 | 19 | 1,617 | 1.2% |
| August 2025 | 14 | 1,451 | 1.0% |
| September 2025 | 18 | 1,560 | 1.2% |
| October 2025 | 15 | 1,450 | 1.0% |
| November 2025 | 17 | 1,505 | 1.1% |
| December 2025 | 15 | 1,603 | 0.9% |
| January 2026 | 23 | 1,739 | 1.3% |
| February 2026 | 19 | 1,607 | 1.2% |
| March 2026 | 20 | 1,843 | 1.1% |
| April 2026 | 21 | 1,725 | 1.2% |
| May 2026 | 24 | 1,797 | 1.3% |
| June 2026 | 19 | 1,697 | 1.1% |
| July 2026 | 22 | 1,733 | 1.3% |
| August 2026 | 18 | 1,557 | 1.2% |
| September 2026 | 26 | 1,777 | 1.5% |
Seasonal comparisons — matched periods
| Period | Appointments / qualifying | Share | Last year | Change |
|---|---|---|---|---|
| June 2025–August 2025 | 52 / 4,855 | 1.1% | June 2024–August 2024: Unavailable / Unavailable (Unavailable) | — |
| September 2025–November 2025 | 50 / 4,515 | 1.1% | September 2024–November 2024: Unavailable / Unavailable (Unavailable) | — |
| December 2025–February 2026 | 57 / 4,949 | 1.2% | December 2024–February 2025: Unavailable / Unavailable (Unavailable) | — |
| March 2026–May 2026 | 65 / 5,365 | 1.2% | March 2025–May 2025: Unavailable / Unavailable (Unavailable) | — |
| June 2026–August 2026 | 59 / 4,987 | 1.2% | June 2025–August 2025: 52 / 4,855 (1.1%) | +0.1 pp |
| September 2026 | 26 / 1,777 | 1.5% | September 2025: 18 / 1,560 (1.2%) | +0.3 pp |
View trends
Other
Clinical concerns outside the other reporting groups.
26 of 1,777 qualifying appointments addressed this concern.
Trailing 12 months: 239 appointments (1.2%) of 20,033.
Exact monthly figures — all saved history
| Month | Topic appointments | Qualifying appointments | Share |
|---|---|---|---|
| June 2025 | 19 | 1,787 | 1.1% |
| July 2025 | 19 | 1,617 | 1.2% |
| August 2025 | 14 | 1,451 | 1.0% |
| September 2025 | 18 | 1,560 | 1.2% |
| October 2025 | 15 | 1,450 | 1.0% |
| November 2025 | 17 | 1,505 | 1.1% |
| December 2025 | 15 | 1,603 | 0.9% |
| January 2026 | 23 | 1,739 | 1.3% |
| February 2026 | 19 | 1,607 | 1.2% |
| March 2026 | 20 | 1,843 | 1.1% |
| April 2026 | 21 | 1,725 | 1.2% |
| May 2026 | 24 | 1,797 | 1.3% |
| June 2026 | 19 | 1,697 | 1.1% |
| July 2026 | 22 | 1,733 | 1.3% |
| August 2026 | 18 | 1,557 | 1.2% |
| September 2026 | 26 | 1,777 | 1.5% |
Seasonal comparisons — matched periods
| Period | Appointments / qualifying | Share | Last year | Change |
|---|---|---|---|---|
| June 2025–August 2025 | 52 / 4,855 | 1.1% | June 2024–August 2024: Unavailable / Unavailable (Unavailable) | — |
| September 2025–November 2025 | 50 / 4,515 | 1.1% | September 2024–November 2024: Unavailable / Unavailable (Unavailable) | — |
| December 2025–February 2026 | 57 / 4,949 | 1.2% | December 2024–February 2025: Unavailable / Unavailable (Unavailable) | — |
| March 2026–May 2026 | 65 / 5,365 | 1.2% | March 2025–May 2025: Unavailable / Unavailable (Unavailable) | — |
| June 2026–August 2026 | 59 / 4,987 | 1.2% | June 2025–August 2025: 52 / 4,855 (1.1%) | +0.1 pp |
| September 2026 | 26 / 1,777 | 1.5% | September 2025: 18 / 1,560 (1.2%) | +0.3 pp |
Wound careShow 4 topics Hide topics 1.0% 1.5% 1.0%1.7% last year
Wound managementView figures and history 0.5% 0.5% 0.5%0.7% last year
Wound management
Wound care, including dressings, stitches and postoperative wound reviews.
8 of 1,777 qualifying appointments addressed this concern.
Trailing 12 months: 109 appointments (0.5%) of 20,033.
Exact monthly figures — all saved history
| Month | Topic appointments | Qualifying appointments | Share |
|---|---|---|---|
| June 2025 | 11 | 1,787 | 0.6% |
| July 2025 | 6 | 1,617 | 0.4% |
| August 2025 | 10 | 1,451 | 0.7% |
| September 2025 | 11 | 1,560 | 0.7% |
| October 2025 | 4 | 1,450 | 0.3% |
| November 2025 | 9 | 1,505 | 0.6% |
| December 2025 | 10 | 1,603 | 0.6% |
| January 2026 | 3 | 1,739 | 0.2% |
| February 2026 | 10 | 1,607 | 0.6% |
| March 2026 | 6 | 1,843 | 0.3% |
| April 2026 | 13 | 1,725 | 0.8% |
| May 2026 | 20 | 1,797 | 1.1% |
| June 2026 | 9 | 1,697 | 0.5% |
| July 2026 | 7 | 1,733 | 0.4% |
| August 2026 | 10 | 1,557 | 0.6% |
| September 2026 | 8 | 1,777 | 0.5% |
Seasonal comparisons — matched periods
| Period | Appointments / qualifying | Share | Last year | Change |
|---|---|---|---|---|
| June 2025–August 2025 | 27 / 4,855 | 0.6% | June 2024–August 2024: Unavailable / Unavailable (Unavailable) | — |
| September 2025–November 2025 | 24 / 4,515 | 0.5% | September 2024–November 2024: Unavailable / Unavailable (Unavailable) | — |
| December 2025–February 2026 | 23 / 4,949 | 0.5% | December 2024–February 2025: Unavailable / Unavailable (Unavailable) | — |
| March 2026–May 2026 | 39 / 5,365 | 0.7% | March 2025–May 2025: Unavailable / Unavailable (Unavailable) | — |
| June 2026–August 2026 | 26 / 4,987 | 0.5% | June 2025–August 2025: 27 / 4,855 (0.6%) | 0.0 pp |
| September 2026 | 8 / 1,777 | 0.5% | September 2025: 11 / 1,560 (0.7%) | -0.3 pp |
Other wound concernsView figures and history 0.2% 0.4% 0.2%0.4% last year
Other wound concerns
Other wound concerns addressed at the appointment.
4 of 1,777 qualifying appointments addressed this concern.
Trailing 12 months: 73 appointments (0.4%) of 20,033.
Exact monthly figures — all saved history
| Month | Topic appointments | Qualifying appointments | Share |
|---|---|---|---|
| June 2025 | 4 | 1,787 | 0.2% |
| July 2025 | 16 | 1,617 | 1.0% |
| August 2025 | 4 | 1,451 | 0.3% |
| September 2025 | 6 | 1,560 | 0.4% |
| October 2025 | 4 | 1,450 | 0.3% |
| November 2025 | 4 | 1,505 | 0.3% |
| December 2025 | 5 | 1,603 | 0.3% |
| January 2026 | 8 | 1,739 | 0.5% |
| February 2026 | 8 | 1,607 | 0.5% |
| March 2026 | 10 | 1,843 | 0.5% |
| April 2026 | 5 | 1,725 | 0.3% |
| May 2026 | 6 | 1,797 | 0.3% |
| June 2026 | 6 | 1,697 | 0.4% |
| July 2026 | 11 | 1,733 | 0.6% |
| August 2026 | 2 | 1,557 | 0.1% |
| September 2026 | 4 | 1,777 | 0.2% |
Seasonal comparisons — matched periods
| Period | Appointments / qualifying | Share | Last year | Change |
|---|---|---|---|---|
| June 2025–August 2025 | 24 / 4,855 | 0.5% | June 2024–August 2024: Unavailable / Unavailable (Unavailable) | — |
| September 2025–November 2025 | 14 / 4,515 | 0.3% | September 2024–November 2024: Unavailable / Unavailable (Unavailable) | — |
| December 2025–February 2026 | 21 / 4,949 | 0.4% | December 2024–February 2025: Unavailable / Unavailable (Unavailable) | — |
| March 2026–May 2026 | 21 / 5,365 | 0.4% | March 2025–May 2025: Unavailable / Unavailable (Unavailable) | — |
| June 2026–August 2026 | 19 / 4,987 | 0.4% | June 2025–August 2025: 24 / 4,855 (0.5%) | -0.1 pp |
| September 2026 | 4 / 1,777 | 0.2% | September 2025: 6 / 1,560 (0.4%) | -0.2 pp |
Wound infectionView figures and history 0.2% 0.4% 0.2%0.4% last year
Wound infection
Wound infection specifically discussed or assessed.
3 of 1,777 qualifying appointments addressed this concern.
Trailing 12 months: 81 appointments (0.4%) of 20,033.
Exact monthly figures — all saved history
| Month | Topic appointments | Qualifying appointments | Share |
|---|---|---|---|
| June 2025 | 9 | 1,787 | 0.5% |
| July 2025 | 11 | 1,617 | 0.7% |
| August 2025 | 9 | 1,451 | 0.6% |
| September 2025 | 6 | 1,560 | 0.4% |
| October 2025 | 6 | 1,450 | 0.4% |
| November 2025 | 11 | 1,505 | 0.7% |
| December 2025 | 6 | 1,603 | 0.4% |
| January 2026 | 2 | 1,739 | 0.1% |
| February 2026 | 11 | 1,607 | 0.7% |
| March 2026 | 4 | 1,843 | 0.2% |
| April 2026 | 7 | 1,725 | 0.4% |
| May 2026 | 6 | 1,797 | 0.3% |
| June 2026 | 10 | 1,697 | 0.6% |
| July 2026 | 7 | 1,733 | 0.4% |
| August 2026 | 8 | 1,557 | 0.5% |
| September 2026 | 3 | 1,777 | 0.2% |
Seasonal comparisons — matched periods
| Period | Appointments / qualifying | Share | Last year | Change |
|---|---|---|---|---|
| June 2025–August 2025 | 29 / 4,855 | 0.6% | June 2024–August 2024: Unavailable / Unavailable (Unavailable) | — |
| September 2025–November 2025 | 23 / 4,515 | 0.5% | September 2024–November 2024: Unavailable / Unavailable (Unavailable) | — |
| December 2025–February 2026 | 19 / 4,949 | 0.4% | December 2024–February 2025: Unavailable / Unavailable (Unavailable) | — |
| March 2026–May 2026 | 17 / 5,365 | 0.3% | March 2025–May 2025: Unavailable / Unavailable (Unavailable) | — |
| June 2026–August 2026 | 25 / 4,987 | 0.5% | June 2025–August 2025: 29 / 4,855 (0.6%) | -0.1 pp |
| September 2026 | 3 / 1,777 | 0.2% | September 2025: 6 / 1,560 (0.4%) | -0.2 pp |
BurnsView figures and history 0.1% 0.2% 0.1%0.3% last year
Burns
Burn assessment or care.
2 of 1,777 qualifying appointments addressed this concern.
Trailing 12 months: 35 appointments (0.2%) of 20,033.
Exact monthly figures — all saved history
| Month | Topic appointments | Qualifying appointments | Share |
|---|---|---|---|
| June 2025 | 6 | 1,787 | 0.3% |
| July 2025 | 3 | 1,617 | 0.2% |
| August 2025 | 3 | 1,451 | 0.2% |
| September 2025 | 4 | 1,560 | 0.3% |
| October 2025 | 3 | 1,450 | 0.2% |
| November 2025 | 4 | 1,505 | 0.3% |
| December 2025 | 4 | 1,603 | 0.2% |
| January 2026 | 3 | 1,739 | 0.2% |
| February 2026 | 1 | 1,607 | 0.1% |
| March 2026 | 2 | 1,843 | 0.1% |
| April 2026 | 1 | 1,725 | 0.1% |
| May 2026 | 3 | 1,797 | 0.2% |
| June 2026 | 6 | 1,697 | 0.4% |
| July 2026 | 2 | 1,733 | 0.1% |
| August 2026 | 4 | 1,557 | 0.3% |
| September 2026 | 2 | 1,777 | 0.1% |
Seasonal comparisons — matched periods
| Period | Appointments / qualifying | Share | Last year | Change |
|---|---|---|---|---|
| June 2025–August 2025 | 12 / 4,855 | 0.2% | June 2024–August 2024: Unavailable / Unavailable (Unavailable) | — |
| September 2025–November 2025 | 11 / 4,515 | 0.2% | September 2024–November 2024: Unavailable / Unavailable (Unavailable) | — |
| December 2025–February 2026 | 8 / 4,949 | 0.2% | December 2024–February 2025: Unavailable / Unavailable (Unavailable) | — |
| March 2026–May 2026 | 6 / 5,365 | 0.1% | March 2025–May 2025: Unavailable / Unavailable (Unavailable) | — |
| June 2026–August 2026 | 12 / 4,987 | 0.2% | June 2025–August 2025: 12 / 4,855 (0.2%) | 0.0 pp |
| September 2026 | 2 / 1,777 | 0.1% | September 2025: 4 / 1,560 (0.3%) | -0.1 pp |
View trends
Wound care
Wound assessment and care, including burns and wound infections.
17 of 1,777 qualifying appointments addressed this concern.
Trailing 12 months: 292 appointments (1.5%) of 20,033.
Exact monthly figures — all saved history
| Month | Topic appointments | Qualifying appointments | Share |
|---|---|---|---|
| June 2025 | 26 | 1,787 | 1.5% |
| July 2025 | 34 | 1,617 | 2.1% |
| August 2025 | 24 | 1,451 | 1.7% |
| September 2025 | 26 | 1,560 | 1.7% |
| October 2025 | 17 | 1,450 | 1.2% |
| November 2025 | 25 | 1,505 | 1.7% |
| December 2025 | 25 | 1,603 | 1.6% |
| January 2026 | 16 | 1,739 | 0.9% |
| February 2026 | 30 | 1,607 | 1.9% |
| March 2026 | 22 | 1,843 | 1.2% |
| April 2026 | 26 | 1,725 | 1.5% |
| May 2026 | 34 | 1,797 | 1.9% |
| June 2026 | 30 | 1,697 | 1.8% |
| July 2026 | 27 | 1,733 | 1.6% |
| August 2026 | 23 | 1,557 | 1.5% |
| September 2026 | 17 | 1,777 | 1.0% |
Seasonal comparisons — matched periods
| Period | Appointments / qualifying | Share | Last year | Change |
|---|---|---|---|---|
| June 2025–August 2025 | 84 / 4,855 | 1.7% | June 2024–August 2024: Unavailable / Unavailable (Unavailable) | — |
| September 2025–November 2025 | 68 / 4,515 | 1.5% | September 2024–November 2024: Unavailable / Unavailable (Unavailable) | — |
| December 2025–February 2026 | 71 / 4,949 | 1.4% | December 2024–February 2025: Unavailable / Unavailable (Unavailable) | — |
| March 2026–May 2026 | 82 / 5,365 | 1.5% | March 2025–May 2025: Unavailable / Unavailable (Unavailable) | — |
| June 2026–August 2026 | 80 / 4,987 | 1.6% | June 2025–August 2025: 84 / 4,855 (1.7%) | -0.1 pp |
| September 2026 | 17 / 1,777 | 1.0% | September 2025: 26 / 1,560 (1.7%) | -0.7 pp |
Weight managementShow 2 topics Hide topics 0.9% 0.6% 0.9%0.5% last year
Obesity & weight-loss careView figures and history 0.6% 0.4% 0.6%0.4% last year
Obesity & weight-loss care
Obesity or weight-loss assessment, treatment and review.
11 of 1,777 qualifying appointments addressed this concern.
Trailing 12 months: 79 appointments (0.4%) of 20,033.
Exact monthly figures — all saved history
| Month | Topic appointments | Qualifying appointments | Share |
|---|---|---|---|
| June 2025 | 4 | 1,787 | 0.2% |
| July 2025 | 2 | 1,617 | 0.1% |
| August 2025 | 4 | 1,451 | 0.3% |
| September 2025 | 6 | 1,560 | 0.4% |
| October 2025 | 3 | 1,450 | 0.2% |
| November 2025 | 4 | 1,505 | 0.3% |
| December 2025 | 4 | 1,603 | 0.2% |
| January 2026 | 3 | 1,739 | 0.2% |
| February 2026 | 1 | 1,607 | 0.1% |
| March 2026 | 4 | 1,843 | 0.2% |
| April 2026 | 7 | 1,725 | 0.4% |
| May 2026 | 7 | 1,797 | 0.4% |
| June 2026 | 11 | 1,697 | 0.6% |
| July 2026 | 15 | 1,733 | 0.9% |
| August 2026 | 9 | 1,557 | 0.6% |
| September 2026 | 11 | 1,777 | 0.6% |
Seasonal comparisons — matched periods
| Period | Appointments / qualifying | Share | Last year | Change |
|---|---|---|---|---|
| June 2025–August 2025 | 10 / 4,855 | 0.2% | June 2024–August 2024: Unavailable / Unavailable (Unavailable) | — |
| September 2025–November 2025 | 13 / 4,515 | 0.3% | September 2024–November 2024: Unavailable / Unavailable (Unavailable) | — |
| December 2025–February 2026 | 8 / 4,949 | 0.2% | December 2024–February 2025: Unavailable / Unavailable (Unavailable) | — |
| March 2026–May 2026 | 18 / 5,365 | 0.3% | March 2025–May 2025: Unavailable / Unavailable (Unavailable) | — |
| June 2026–August 2026 | 35 / 4,987 | 0.7% | June 2025–August 2025: 10 / 4,855 (0.2%) | +0.5 pp |
| September 2026 | 11 / 1,777 | 0.6% | September 2025: 6 / 1,560 (0.4%) | +0.2 pp |
Other weight-management concernsView figures and history 0.3% 0.2% 0.3%0.1% last year
Other weight-management concerns
Other weight-management concerns.
5 of 1,777 qualifying appointments addressed this concern.
Trailing 12 months: 33 appointments (0.2%) of 20,033.
Exact monthly figures — all saved history
| Month | Topic appointments | Qualifying appointments | Share |
|---|---|---|---|
| June 2025 | 1 | 1,787 | 0.1% |
| July 2025 | 0 | 1,617 | 0.0% |
| August 2025 | 4 | 1,451 | 0.3% |
| September 2025 | 2 | 1,560 | 0.1% |
| October 2025 | 1 | 1,450 | 0.1% |
| November 2025 | 0 | 1,505 | 0.0% |
| December 2025 | 2 | 1,603 | 0.1% |
| January 2026 | 3 | 1,739 | 0.2% |
| February 2026 | 3 | 1,607 | 0.2% |
| March 2026 | 1 | 1,843 | 0.1% |
| April 2026 | 3 | 1,725 | 0.2% |
| May 2026 | 4 | 1,797 | 0.2% |
| June 2026 | 3 | 1,697 | 0.2% |
| July 2026 | 4 | 1,733 | 0.2% |
| August 2026 | 4 | 1,557 | 0.3% |
| September 2026 | 5 | 1,777 | 0.3% |
Seasonal comparisons — matched periods
| Period | Appointments / qualifying | Share | Last year | Change |
|---|---|---|---|---|
| June 2025–August 2025 | 5 / 4,855 | 0.1% | June 2024–August 2024: Unavailable / Unavailable (Unavailable) | — |
| September 2025–November 2025 | 3 / 4,515 | 0.1% | September 2024–November 2024: Unavailable / Unavailable (Unavailable) | — |
| December 2025–February 2026 | 8 / 4,949 | 0.2% | December 2024–February 2025: Unavailable / Unavailable (Unavailable) | — |
| March 2026–May 2026 | 8 / 5,365 | 0.1% | March 2025–May 2025: Unavailable / Unavailable (Unavailable) | — |
| June 2026–August 2026 | 11 / 4,987 | 0.2% | June 2025–August 2025: 5 / 4,855 (0.1%) | +0.1 pp |
| September 2026 | 5 / 1,777 | 0.3% | September 2025: 2 / 1,560 (0.1%) | +0.2 pp |
View trends
Weight management
Weight-related assessment, weight-loss care and weight-management reviews.
16 of 1,777 qualifying appointments addressed this concern.
Trailing 12 months: 112 appointments (0.6%) of 20,033.
Exact monthly figures — all saved history
| Month | Topic appointments | Qualifying appointments | Share |
|---|---|---|---|
| June 2025 | 5 | 1,787 | 0.3% |
| July 2025 | 2 | 1,617 | 0.1% |
| August 2025 | 8 | 1,451 | 0.6% |
| September 2025 | 8 | 1,560 | 0.5% |
| October 2025 | 4 | 1,450 | 0.3% |
| November 2025 | 4 | 1,505 | 0.3% |
| December 2025 | 6 | 1,603 | 0.4% |
| January 2026 | 6 | 1,739 | 0.3% |
| February 2026 | 4 | 1,607 | 0.2% |
| March 2026 | 5 | 1,843 | 0.3% |
| April 2026 | 10 | 1,725 | 0.6% |
| May 2026 | 11 | 1,797 | 0.6% |
| June 2026 | 14 | 1,697 | 0.8% |
| July 2026 | 19 | 1,733 | 1.1% |
| August 2026 | 13 | 1,557 | 0.8% |
| September 2026 | 16 | 1,777 | 0.9% |
Seasonal comparisons — matched periods
| Period | Appointments / qualifying | Share | Last year | Change |
|---|---|---|---|---|
| June 2025–August 2025 | 15 / 4,855 | 0.3% | June 2024–August 2024: Unavailable / Unavailable (Unavailable) | — |
| September 2025–November 2025 | 16 / 4,515 | 0.4% | September 2024–November 2024: Unavailable / Unavailable (Unavailable) | — |
| December 2025–February 2026 | 16 / 4,949 | 0.3% | December 2024–February 2025: Unavailable / Unavailable (Unavailable) | — |
| March 2026–May 2026 | 26 / 5,365 | 0.5% | March 2025–May 2025: Unavailable / Unavailable (Unavailable) | — |
| June 2026–August 2026 | 46 / 4,987 | 0.9% | June 2025–August 2025: 15 / 4,855 (0.3%) | +0.6 pp |
| September 2026 | 16 / 1,777 | 0.9% | September 2025: 8 / 1,560 (0.5%) | +0.4 pp |
No matching topics.
Small counts are descriptive. Use the longer periods for context; a large percentage change from a small starting count does not establish a meaningful trend.
“Download this view (CSV)” exports the selected period and matching topics. View all edition downloads →
Source: DocTap Health Pulse, September 2026. Please credit DocTap and link to this report when reusing these figures. https://doctap.co.uk/health-pulse/2026/september?revision=639265256347842052
Published revisions and citation links
How to interpret and reuse these figures
Based on 1,777 DocTap GP appointments analysed in September 2026.
Methodology: health-pulse-2. Topics include concerns and working diagnoses, not confirmed disease incidence.
About these figures
This report analyses completed DocTap clinic and remote GP appointments addressing new concerns or follow-up reviews. Concerns are grouped using AI-assisted classification of consultation notes. Routine repeat-medication, results-discussion, paperwork and preventive-only records are excluded.
Each appointment counts once in the analysis total and once in each relevant category. Categories can overlap, and a person attending more than once contributes more than one appointment. These figures describe appointments analysed, not the prevalence of conditions in the population. Changes may reflect who uses DocTap and the services they use, as well as the concerns patients bring.
Historical figures were compiled retrospectively from consultation records. Reports are prepared with AI assistance and reviewed and clinically approved by a DocTap GP before publication. Clinical review is not an independent audit of every classification. The figures describe recorded appointment activity and do not establish why differences occurred.
Full methodology and category definitions
Appointments are grouped by their date in the UK calendar month. Deleted records and results-review appointment records are excluded. New-concern and follow-up records need an included primary concern category; relevant secondary categories from those records are included too. Missing or unusable classifications are excluded. Other is an included category for concerns outside the remaining categories, not a label for missing classifications.
An appointment is counted once per category even if several notes mention it. Secondary concerns on excluded records do not bring those records back into scope. Shares need not total 100%. The analysis total is not DocTap's total appointment activity.
Exact counts include small counts. Percentages and percentage-point changes are rounded to one decimal place from unrounded figures. Seasonal shares divide summed category counts by summed analysis denominators, not average monthly percentages. Winter is December–February, spring March–May, summer June–August and autumn September–November. Each edition compares its season through the completed reporting month with exactly the same months one year earlier. December uses one month, January uses December–January and February uses the complete winter. No unfinished month is included or forecast.
Missing history or any month with no analysed appointments makes the period unavailable. Seasonal downloads include completed seasons and the current season so far. The monthly download also retains rolling three-month comparisons for reuse. These figures are not seasonally adjusted. Comparisons describe differences in recorded appointments; they do not by themselves establish recurring seasonality, a sustained trend or a change in population health. No population representativeness or statistical significance is implied.
The written summary may refer to the most common working diagnoses within a category. These come from clinician-coded consultation records among appointments where that category was the main concern; a diagnosis recorded in fewer than 5 appointments in a month is never used, and appointments without a coded diagnosis are left out of that comparison. Working diagnoses are the diagnoses the GP coded at the time of the appointment, including ones the GP marked as possible. They are not confirmed diagnoses and can change after tests or follow-up.
History starts in June 2025. The monthly data covers the published concern groups, topics and subtopics, not a complete list of individual diagnoses. Selected monthly diagnosis lists must not be added into seasonal diagnosis totals. Each report retains its saved figures and definitions; later classification work does not automatically change earlier reports. Changes to published figures require renewed clinical approval and a visible correction note.
- Acute respiratory illness
- Acute respiratory infections and other short-term cough or respiratory concerns.
- Ear, nose & throat
- Ear, hearing, nose, sinus, throat and voice concerns.
- Allergies
- Allergy-related concerns, including hay fever, food or medicine allergies and allergic reactions.
- Lung & breathing
- Asthma, COPD, persistent cough, breathlessness and other lung or breathing concerns.
- Skin
- Skin concerns, including rashes, eczema, acne, infections, moles and other lesions.
- Hair & nails
- Hair loss, other hair concerns, nail infections and other nail problems.
- Wound care
- Wound assessment and care, including burns and wound infections.
- Mental health & wellbeing
- Mental health, sleep, attention, neurodevelopmental and substance-use concerns.
- Sexual health
- Sexual health symptoms, exposure, infections, testing and HIV prevention or care.
- Women's & gynaecological health
- Menstrual, menopause, contraceptive, pregnancy, fertility, breast and gynaecological concerns.
- Men's & urogenital health
- Erectile, prostate, testicular, scrotal and penile concerns.
- Digestion & gut
- Digestive symptoms and conditions, including bowel and anorectal concerns.
- Urinary & kidney
- Urinary symptoms, urinary tract infections and kidney concerns.
- Muscles, bones & joints
- Back, neck, joint, muscle and limb concerns, including injuries and arthritis.
- Headaches & neurological
- Headache, migraine, dizziness, balance, nerve and other neurological concerns.
- Heart, blood pressure & circulation
- Heart, rhythm, blood pressure, cholesterol and circulation concerns.
- Hormones, diabetes & thyroid
- Diabetes, prediabetes, thyroid and other hormonal concerns.
- Weight management
- Weight-related assessment, weight-loss care and weight-management reviews.
- Tiredness & general symptoms
- Fatigue, anaemia, deficiency, fever and other general or unexplained symptoms.
- Eye & vision
- Eye, eyelid and vision concerns.
- Mouth & dental
- Tooth, gum and other mouth concerns.
- Other
- Clinical concerns outside the other reporting groups.
- Chest infections
- Pneumonia and other chest infections discussed or assessed at the appointment.
- Ear infections
- Infections affecting the outer or middle ear, and other ear infections.
- Hearing loss & tinnitus
- Hearing loss, tinnitus and other hearing concerns.
- Sinusitis & other nose concerns
- Sinusitis and other nasal symptoms or concerns.
- Tonsillitis & other throat concerns
- Tonsillitis, other sore throats, voice problems and other throat concerns.
- Hives & allergic reactions
- Hives, urticaria and other allergic reactions discussed or assessed.
- Breathlessness & other lung concerns
- Unexplained breathlessness and other lung conditions or concerns.
- Eczema & dermatitis
- Eczema, contact dermatitis and other forms of dermatitis.
- Skin infections & infestations
- Bacterial, fungal or viral skin infections, and skin infestations.
- Moles, lumps & skin lesions
- Moles, pigmented lesions, skin lumps and other skin lesions assessed at the appointment.
- Other rashes, itching & skin concerns
- Rashes, itching and other skin concerns without a more specific recorded category.
- Nail infections
- Fungal nail infections, nail-fold infections and other nail infections.
- Insomnia & sleep concerns
- Insomnia and other non-respiratory sleep concerns.
- Autism & other neurodevelopmental concerns
- Autism and other neurodevelopmental concerns specifically discussed or assessed.
- Alcohol & substance use
- Alcohol-related concerns and other substance-use assessment or support.
- Diagnosed or specifically suspected STIs
- Named sexually transmitted infections diagnosed or specifically suspected and addressed. Counts include suspected infections.
- PrEP & PEP
- HIV pre-exposure prophylaxis (PrEP) and post-exposure prophylaxis (PEP) concerns within qualifying appointments.
- Period & bleeding concerns
- Heavy, painful, irregular or absent periods and other menstrual bleeding concerns.
- Vaginal & vulval concerns
- Vaginal or vulval concerns, including thrush and bacterial vaginosis.
- Breast concerns
- Breast lumps, pain and other breast concerns assessed at the appointment.
- Prostate concerns
- Prostatitis and other prostate-related symptoms or concerns.
- Penile concerns
- Balanitis and other penile symptoms or concerns.
- Inflammatory bowel disease
- Crohn's disease, ulcerative colitis and other inflammatory bowel disease concerns.
- Gastroenteritis, diarrhoea & vomiting
- Gastroenteritis, diarrhoea and vomiting concerns.
- Haemorrhoids & other anorectal concerns
- Haemorrhoids, anal fissures and other anorectal symptoms or concerns.
- Urinary tract infections
- Lower urinary tract infections, kidney infections and other urinary tract infection concerns, including suspected infections.
- Back pain & sciatica
- Back pain and sciatica concerns assessed at the appointment.
- Arthritis
- Osteoarthritis, inflammatory arthritis and other arthritis concerns.
- Dizziness & balance concerns
- Vertigo, balance disorders and other dizziness concerns.
- Palpitations & rhythm concerns
- Palpitations and known heart rhythm conditions assessed at the appointment.
- Diabetes
- Type 1, type 2 and other diabetes concerns.
- Thyroid conditions
- Underactive thyroid, overactive thyroid and other thyroid concerns.
- Anaemia
- Iron-deficiency anaemia and other anaemia concerns.
- Vitamin & mineral deficiencies
- Iron, vitamin B12, folate, vitamin D and other vitamin or mineral deficiency concerns.
- Eyelid concerns
- Styes, chalazia, blepharitis and other eyelid concerns.
- Other mouth concerns
- Oral thrush, mouth ulcers and other mouth concerns.
- Colds & upper respiratory infections
- Colds and other acute upper respiratory infections addressed at the appointment.
- Influenza & flu-like illness
- Influenza or flu-like illness discussed or assessed, including suspected influenza.
- COVID-19
- COVID-19 illness or specifically suspected COVID-19 discussed or assessed.
- Pneumonia
- Pneumonia specifically discussed or assessed, including suspected pneumonia.
- Other chest infections
- Chest infections other than specifically recorded pneumonia, including bronchitis.
- Other acute cough & respiratory illness
- Other acute respiratory illness or cough, including cough following a viral illness.
- Outer ear infection
- An infection of the outer ear or ear canal discussed or assessed.
- Middle ear infection
- An infection of the middle ear discussed or assessed.
- Other ear infection
- Other ear infections without a more specific recorded type.
- Ear wax & blocked ears
- Ear wax, a blocked-ear sensation or ear pressure addressed at the appointment.
- Hearing loss
- Reduced hearing or hearing loss discussed or assessed.
- Tinnitus
- Tinnitus, such as ringing or other sounds heard in the ears.
- Other hearing concerns
- Other hearing concerns without a more specific recorded category.
- Sinusitis
- Sinusitis specifically discussed or assessed.
- Other nose concerns
- Other nasal symptoms or concerns, such as obstruction or nosebleeds.
- Tonsillitis
- Tonsillitis specifically discussed or assessed.
- Other sore throat
- Other sore throat concerns without a more specific recorded cause.
- Voice & other throat concerns
- Voice problems and other throat concerns.
- Other ENT concerns
- Other specifically assessed ear, nose or throat concerns.
- Hay fever
- Hay fever or pollen-related allergic rhinitis addressed at the appointment.
- Other allergic rhinitis
- Other allergic rhinitis, including year-round or unspecified allergic rhinitis.
- Food allergy
- Food allergy concerns assessed or managed, including suspected allergy.
- Drug allergy
- Suspected or established allergic reactions to medicines.
- Hives/urticaria
- Hives or urticaria discussed or assessed. This category does not establish an allergic cause.
- Other allergic reactions
- Other allergic reactions discussed or assessed.
- Other allergy concerns
- Other allergy concerns and allergy-related questions addressed at the appointment.
- Asthma
- Asthma assessment, flare-ups or substantive reviews.
- COPD
- Chronic obstructive pulmonary disease (COPD) discussed or reviewed.
- Persistent cough
- Persistent or chronic cough assessed without a more specific recorded cause.
- Unexplained breathlessness
- Breathlessness assessed without an established cause recorded for that concern.
- Other lung conditions
- Other lung conditions or respiratory concerns.
- Eczema
- Eczema specifically discussed or assessed.
- Contact dermatitis
- Contact dermatitis specifically discussed or assessed.
- Other dermatitis
- Other forms of dermatitis discussed or assessed.
- Psoriasis
- Psoriasis assessment, treatment or review.
- Acne
- Acne assessment, treatment or review.
- Rosacea
- Rosacea assessment, treatment or review.
- Bacterial skin infections
- Bacterial skin infection concerns discussed or assessed.
- Fungal skin infections
- Fungal skin infection concerns discussed or assessed.
- Shingles
- Shingles specifically discussed or assessed.
- Other viral skin infections
- Other viral skin infection concerns.
- Scabies/other infestations
- Scabies or other skin infestations discussed or assessed.
- Mole/pigmented-lesion concerns
- Moles or other pigmented skin lesions assessed at the appointment.
- Other skin lumps & lesions
- Other skin lumps or lesions, including cysts and lipomas.
- Bites & stings
- Skin concerns relating to bites or stings, including infected bites.
- Unspecified rash/itching
- Rash or itching without a more specific recorded skin diagnosis.
- Other skin concerns
- Other skin concerns without a more specific recorded category.
- Hair loss
- Hair loss specifically discussed or assessed.
- Fungal nail infection
- Fungal nail infection specifically discussed or assessed.
- Nail-fold infection
- Infection around a nail fold specifically discussed or assessed.
- Other nail infection
- Other nail infection concerns.
- Other nail concerns
- Other nail symptoms or concerns.
- Other hair concerns
- Other hair-related symptoms or concerns.
- Wound management
- Wound care, including dressings, stitches and postoperative wound reviews.
- Wound infection
- Wound infection specifically discussed or assessed.
- Burns
- Burn assessment or care.
- Other wound concerns
- Other wound concerns addressed at the appointment.
- Anxiety
- Anxiety concerns, including assessment, treatment and review.
- Depression & low mood
- Depression or low mood discussed or assessed.
- Stress & burnout
- Stress or burnout concerns, including work-related concerns discussed at the appointment.
- Insomnia
- Insomnia specifically discussed or assessed.
- Other sleep concerns
- Other non-respiratory sleep concerns.
- ADHD
- Attention deficit hyperactivity disorder (ADHD) specifically discussed or assessed.
- Autism
- Appointments where autism was specifically discussed or assessed.
- Other neurodevelopmental concerns
- Other neurodevelopmental concerns discussed or assessed.
- OCD
- Obsessive compulsive disorder (OCD) specifically discussed or assessed.
- Trauma & PTSD
- Trauma-related concerns or post-traumatic stress disorder (PTSD) discussed or assessed.
- Eating disorders
- Eating disorder concerns discussed or assessed.
- Alcohol-related concerns
- Alcohol-related concerns discussed or assessed, including support with alcohol use.
- Other substance use
- Other substance-use concerns discussed or assessed, including support with drug use.
- Other mental health concerns
- Other mental health concerns without a more specific recorded category.
- STI symptoms or exposure
- Symptoms or exposure concerns relating to sexually transmitted infections (STIs).
- Chlamydia
- Chlamydia diagnosed or specifically suspected and addressed at the appointment.
- Gonorrhoea
- Gonorrhoea diagnosed or specifically suspected and addressed at the appointment.
- Syphilis
- Syphilis diagnosed or specifically suspected and addressed at the appointment.
- Genital herpes
- Genital herpes specifically discussed or assessed, including suspected infection.
- Genital warts
- Genital warts specifically discussed or assessed.
- Other STIs
- Other named sexually transmitted infections diagnosed or specifically suspected.
- HIV-related concerns
- HIV-related concerns, including assessment, treatment and review.
- PrEP
- HIV pre-exposure prophylaxis (PrEP) concerns within qualifying appointments.
- PEP
- HIV post-exposure prophylaxis (PEP) concerns within qualifying appointments.
- Sexual health testing
- Sexual health testing relating to a clinical concern or exposure.
- Other sexual health concerns
- Other sexual health concerns without a more specific recorded category.
- Menopause & perimenopause
- Menopause or perimenopause symptoms, treatment or review.
- Heavy bleeding
- Heavy menstrual bleeding specifically discussed or assessed.
- Painful periods
- Painful periods specifically discussed or assessed.
- Irregular/absent periods
- Irregular or absent periods specifically discussed or assessed.
- Other bleeding concerns
- Other menstrual bleeding concerns.
- Endometriosis
- Endometriosis specifically discussed or assessed.
- PCOS
- Polycystic ovary syndrome (PCOS) specifically discussed or assessed.
- Contraception
- Contraceptive advice, prescribing or review.
- Pregnancy & postnatal concerns
- Pregnancy-related or postnatal concerns addressed at the appointment.
- Fertility
- Fertility concerns discussed or assessed.
- Thrush
- Vaginal or vulval thrush specifically discussed or assessed.
- Bacterial vaginosis
- Bacterial vaginosis specifically discussed or assessed.
- Other vaginal/vulval concerns
- Other vaginal or vulval symptoms and concerns.
- Breast lump
- A breast lump specifically discussed or assessed. This category does not establish a cancer diagnosis.
- Other breast concerns
- Other breast symptoms or concerns, such as breast pain.
- Other pelvic & gynaecological concerns
- Other pelvic or gynaecological concerns.
- Erectile dysfunction
- Erectile dysfunction specifically discussed or assessed.
- Prostatitis
- Prostatitis specifically discussed or assessed.
- Other prostate concerns
- Other prostate-related symptoms or concerns.
- Testicular & scrotal concerns
- Testicular or scrotal symptoms and concerns.
- Balanitis
- Balanitis specifically discussed or assessed.
- Other penile concerns
- Other penile symptoms or concerns.
- Other men's health concerns
- Other men's health concerns without a more specific recorded category.
- Reflux & indigestion
- Acid reflux, heartburn or indigestion discussed or assessed.
- IBS
- Irritable bowel syndrome (IBS) specifically discussed or assessed.
- Crohn's disease
- Crohn's disease specifically discussed or assessed.
- Ulcerative colitis
- Ulcerative colitis specifically discussed or assessed.
- Other/unspecified IBD
- Other or unspecified inflammatory bowel disease (IBD) concerns.
- Gastroenteritis
- Gastroenteritis specifically discussed or assessed.
- Other diarrhoea/vomiting
- Other diarrhoea or vomiting concerns.
- Constipation
- Constipation discussed or assessed.
- Abdominal pain & bloating
- Abdominal pain or bloating discussed or assessed.
- Haemorrhoids
- Haemorrhoids specifically discussed or assessed.
- Anal fissure
- Anal fissure specifically discussed or assessed.
- Other anorectal concerns
- Other anorectal symptoms or concerns, such as rectal bleeding.
- Hernias
- Hernia concerns assessed or reviewed.
- Other digestive concerns
- Other digestive symptoms or conditions.
- Lower UTI/cystitis
- Lower urinary tract infection or cystitis concerns, including suspected infection.
- Kidney infection
- Kidney infection specifically discussed or assessed, including suspected infection.
- Other/unspecified UTI
- Other or unspecified urinary tract infection concerns.
- Kidney stones
- Kidney stones specifically discussed or assessed.
- Chronic kidney disease
- Chronic kidney disease specifically discussed or reviewed.
- Other urinary symptoms
- Other urinary symptoms without a more specific recorded category.
- Other kidney concerns
- Other kidney-related symptoms or concerns.
- Back pain without specified sciatica
- Back pain assessed without specifically recorded sciatica.
- Sciatica
- Sciatica specifically discussed or assessed.
- Neck pain
- Neck pain discussed or assessed.
- Osteoarthritis
- Osteoarthritis specifically discussed or assessed.
- Inflammatory arthritis
- Inflammatory arthritis specifically discussed or assessed.
- Other/unspecified arthritis
- Other or unspecified arthritis concerns.
- Gout
- Gout specifically discussed or assessed.
- Joint & limb pain
- Joint or limb pain discussed or assessed.
- Injuries & soft-tissue concerns
- Injuries or soft-tissue concerns, such as sprains and strains.
- Other musculoskeletal concerns
- Other muscle, bone or joint concerns.
- Migraine
- Migraine specifically discussed or assessed.
- Other headaches
- Other headache concerns.
- Vertigo/balance disorder
- Vertigo or a balance disorder specifically discussed or assessed.
- Other dizziness
- Other dizziness concerns.
- Numbness, tingling & nerve concerns
- Numbness, tingling or nerve-related concerns discussed or assessed.
- Other neurological concerns
- Other neurological concerns without a more specific recorded category.
- High blood pressure
- High blood pressure assessment, treatment or review.
- Cholesterol
- Cholesterol-related assessment, treatment or review.
- Palpitations without named diagnosis
- Palpitations assessed without a named heart rhythm diagnosis recorded for that concern.
- Known rhythm conditions
- Known heart rhythm conditions discussed or reviewed.
- Chest pain
- Chest pain discussed or assessed. This category does not establish a heart disease diagnosis.
- Circulation & leg swelling
- Circulation concerns or leg swelling discussed or assessed.
- Other heart conditions
- Other heart conditions discussed or assessed.
- Type 1 diabetes
- Type 1 diabetes assessment, treatment or review.
- Type 2 diabetes
- Type 2 diabetes assessment, treatment or review.
- Other/unspecified diabetes
- Other or unspecified diabetes concerns.
- Prediabetes
- Prediabetes specifically discussed or assessed.
- Underactive thyroid
- Underactive thyroid specifically discussed or assessed.
- Overactive thyroid
- Overactive thyroid specifically discussed or assessed.
- Other thyroid concerns
- Other thyroid-related concerns.
- Other hormonal concerns
- Other hormonal concerns discussed or assessed.
- Obesity & weight-loss care
- Obesity or weight-loss assessment, treatment and review.
- Other weight-management concerns
- Other weight-management concerns.
- Fatigue & tiredness
- Fatigue or tiredness assessed without a more specific recorded cause.
- Iron-deficiency anaemia
- Iron-deficiency anaemia specifically discussed or assessed.
- Other anaemia
- Other anaemia concerns.
- Iron deficiency without anaemia
- Iron deficiency without anaemia specifically discussed or assessed.
- B12/folate
- Vitamin B12 or folate deficiency concerns discussed or assessed.
- Vitamin D
- Vitamin D deficiency concerns discussed or assessed.
- Other deficiencies
- Other vitamin or mineral deficiency concerns.
- Fever & systemic illness
- Fever or systemic illness concerns discussed or assessed.
- Lymph nodes & unexplained lumps
- Lymph nodes or unexplained lumps discussed or assessed.
- Other general symptoms
- Other general symptoms without a more specific recorded category.
- Conjunctivitis
- Conjunctivitis specifically discussed or assessed.
- Stye/chalazion
- A stye or chalazion specifically discussed or assessed.
- Blepharitis
- Blepharitis specifically discussed or assessed.
- Other eyelid concerns
- Other eyelid symptoms or concerns.
- Other eye & vision concerns
- Other eye symptoms, vision changes or eye conditions.
- Dental concerns
- Tooth or gum concerns, including pain or dental infection.
- Oral thrush
- Oral thrush specifically discussed or assessed.
- Mouth ulcers
- Mouth ulcers specifically discussed or assessed.
- Other mouth concerns
- Other mouth symptoms or concerns.
- Other specified concerns
- Other specifically assessed clinical concerns outside the defined topics.
Media enquiries and questions about these figures: patients@doctap.co.uk.
Download this edition
Choose the report for reading and sharing, or CSV data for analysis. Downloads correspond to this published revision.
Full report
Findings, figures, methodology and every published topic and subtopic.
Download report (PDF)Monthly data
All topics, exact counts and monthly history saved with this edition.
Download monthly data (CSV)Seasonal comparisons
Seasonal counts and shares, with comparisons to the same period a year earlier.
Download seasonal data (CSV)Download chart (SVG) · Please credit DocTap and link to this report when reusing these figures.